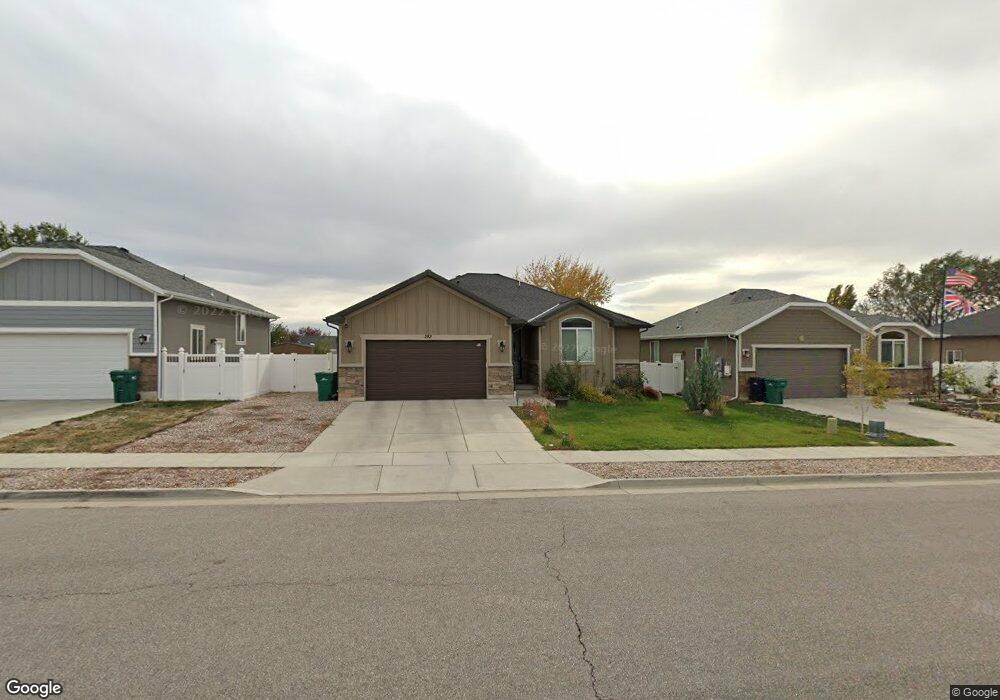
282 W 125 N Unit 105 Clearfield, UT 84015
Estimated Value: $497,761 - $566,000
4
Beds
2
Baths
2,782
Sq Ft
$189/Sq Ft
Est. Value
About This Home
This home is located at 282 W 125 N Unit 105, Clearfield, UT 84015 and is currently estimated at $525,440, approximately $188 per square foot. 282 W 125 N Unit 105 is a home located in Davis County with nearby schools including Wasatch Elementary School, North Davis Junior High School, and Clearfield High School.
Ownership History
Date
Name
Owned For
Owner Type
Purchase Details
Closed on
Sep 25, 2020
Sold by
Page Jacqueline L
Bought by
Johnson April C and Johnson Barl L
Current Estimated Value
Home Financials for this Owner
Home Financials are based on the most recent Mortgage that was taken out on this home.
Original Mortgage
$125,000
Outstanding Balance
$109,917
Interest Rate
2.9%
Mortgage Type
New Conventional
Estimated Equity
$415,523
Purchase Details
Closed on
Mar 3, 2016
Sold by
Bluemontain Inc
Bought by
Page Jacqueline L
Purchase Details
Closed on
Sep 26, 2014
Sold by
Wall Brothers Construction Llc
Bought by
Bluemountain Inc
Home Financials for this Owner
Home Financials are based on the most recent Mortgage that was taken out on this home.
Original Mortgage
$480,000
Interest Rate
4.09%
Mortgage Type
Construction
Create a Home Valuation Report for This Property
The Home Valuation Report is an in-depth analysis detailing your home's value as well as a comparison with similar homes in the area
Home Values in the Area
Average Home Value in this Area
Purchase History
| Date | Buyer | Sale Price | Title Company |
|---|---|---|---|
| Johnson April C | -- | Backman Title Ser | |
| Page Jacqueline L | -- | Founders Title | |
| Bluemountain Inc | -- | Founders Title Co |
Source: Public Records
Mortgage History
| Date | Status | Borrower | Loan Amount |
|---|---|---|---|
| Open | Johnson April C | $125,000 | |
| Previous Owner | Bluemountain Inc | $480,000 |
Source: Public Records
Tax History
| Year | Tax Paid | Tax Assessment Tax Assessment Total Assessment is a certain percentage of the fair market value that is determined by local assessors to be the total taxable value of land and additions on the property. | Land | Improvement |
|---|---|---|---|---|
| 2025 | $2,688 | $240,900 | $65,215 | $175,685 |
| 2024 | $2,821 | $254,650 | $62,396 | $192,254 |
| 2023 | $2,716 | $450,000 | $100,527 | $349,473 |
| 2022 | $2,885 | $258,500 | $58,237 | $200,263 |
| 2021 | $2,585 | $350,000 | $58,488 | $291,512 |
| 2020 | $2,328 | $313,000 | $48,575 | $264,425 |
| 2019 | $2,396 | $318,000 | $53,204 | $264,796 |
| 2018 | $2,204 | $285,000 | $47,224 | $237,776 |
| 2016 | $1,915 | $129,470 | $18,637 | $110,833 |
| 2015 | $403 | $25,350 | $18,637 | $6,713 |
Source: Public Records
Map
Nearby Homes