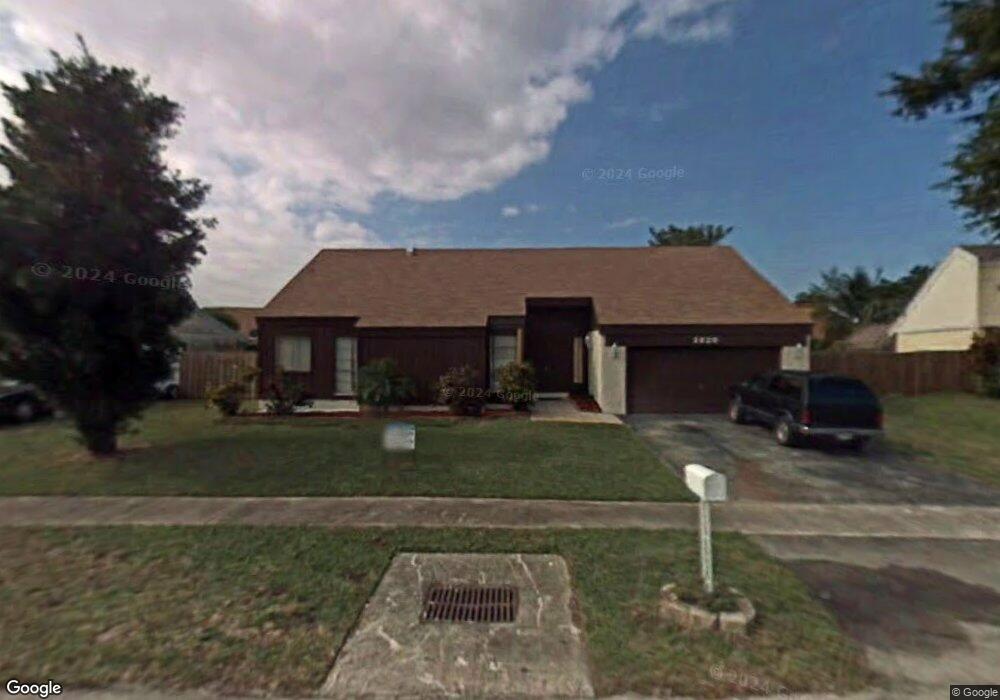
2820 Buttonwood Ave Miramar, FL 33025
Miramar Park NeighborhoodEstimated Value: $486,924 - $557,000
3
Beds
2
Baths
1,511
Sq Ft
$344/Sq Ft
Est. Value
About This Home
This home is located at 2820 Buttonwood Ave, Miramar, FL 33025 and is currently estimated at $519,981, approximately $344 per square foot. 2820 Buttonwood Ave is a home located in Broward County with nearby schools including Sea Castle Elementary School, New Renaissance Middle School, and Miramar High School.
Ownership History
Date
Name
Owned For
Owner Type
Purchase Details
Closed on
May 25, 1999
Sold by
Cowen Investments Inc
Bought by
Jones Waymond and Sanders Cynthia
Current Estimated Value
Home Financials for this Owner
Home Financials are based on the most recent Mortgage that was taken out on this home.
Original Mortgage
$117,750
Outstanding Balance
$29,996
Interest Rate
6.87%
Mortgage Type
New Conventional
Estimated Equity
$489,985
Purchase Details
Closed on
Oct 23, 1998
Sold by
Jgv Investments Inc
Bought by
Cowen Investments Inc
Purchase Details
Closed on
Oct 15, 1998
Sold by
Clerk Of The Court
Bought by
Monopoly Investments Inc
Purchase Details
Closed on
Oct 6, 1998
Sold by
Monopoly Investments Inc
Bought by
Reef Financial Group
Purchase Details
Closed on
Oct 1, 1992
Sold by
Available Not
Bought by
Available Not
Create a Home Valuation Report for This Property
The Home Valuation Report is an in-depth analysis detailing your home's value as well as a comparison with similar homes in the area
Home Values in the Area
Average Home Value in this Area
Purchase History
| Date | Buyer | Sale Price | Title Company |
|---|---|---|---|
| Jones Waymond | $120,000 | -- | |
| Cowen Investments Inc | $85,000 | -- | |
| Jgv Investments Inc | $100 | -- | |
| Monopoly Investments Inc | $77,800 | -- | |
| Reef Financial Group | $100 | -- | |
| Available Not | $100,000 | -- |
Source: Public Records
Mortgage History
| Date | Status | Borrower | Loan Amount |
|---|---|---|---|
| Open | Reef Financial Group | $117,750 |
Source: Public Records
Tax History Compared to Growth
Tax History
| Year | Tax Paid | Tax Assessment Tax Assessment Total Assessment is a certain percentage of the fair market value that is determined by local assessors to be the total taxable value of land and additions on the property. | Land | Improvement |
|---|---|---|---|---|
| 2025 | $8,460 | $407,370 | -- | -- |
| 2024 | $8,033 | $407,370 | -- | -- |
| 2023 | $8,033 | $336,680 | $0 | $0 |
| 2022 | $6,595 | $306,080 | $29,430 | $276,650 |
| 2021 | $6,204 | $281,710 | $29,430 | $252,280 |
| 2020 | $5,979 | $269,520 | $29,430 | $240,090 |
| 2019 | $5,655 | $260,520 | $29,430 | $231,090 |
| 2018 | $5,081 | $234,030 | $29,430 | $204,600 |
| 2017 | $4,680 | $202,790 | $0 | $0 |
| 2016 | $4,419 | $184,360 | $0 | $0 |
| 2015 | $4,129 | $167,600 | $0 | $0 |
| 2014 | $3,725 | $152,370 | $0 | $0 |
| 2013 | -- | $138,520 | $29,440 | $109,080 |
Source: Public Records
Map
Nearby Homes
- 3199 Foxcroft Rd Unit 311
- 3252 Foxcroft Rd Unit 206
- 3252 Foxcroft Rd Unit 208
- 3252 Foxcroft Rd Unit 316
- 3390 Foxcroft Rd Unit C212
- 3131 Jasper Way
- 9291 E Fern Ln
- 3399 Foxcroft Rd Unit 108
- 3399 Foxcroft Rd Unit 315
- 9500 Atlantic St
- 3490 Foxcroft Rd Unit B212
- 3490 Foxcroft Rd Unit B203
- 3490 Foxcroft Rd Unit B102
- 3230 Jasper Way
- 3396 Foxcroft Rd Unit 305
- 3396 Foxcroft Rd Unit 113
- 3396 Foxcroft Rd Unit 308
- 9511 Hudson St
- 3253 Foxcroft Rd Unit G107
- 3253 Foxcroft Rd Unit G305
- 2810 Buttonwood Ave
- 2900 Buttonwood Ave
- 2901 Cypress Ave
- 2821 Cypress Ave
- 2911 Cypress Ave
- 2821 Buttonwood Ave
- 2800 Buttonwood Ave
- 2811 Cypress Ave
- 2910 Buttonwood Ave
- 2921 Cypress Ave
- 2751 Buttonwood Ave
- 2801 Cypress Ave
- 2750 Buttonwood Ave
- 2900 Cypress Ave
- 2830 Cypress Ave
- 2911 Buttonwood Ave
- 2920 Buttonwood Ave
- 2910 Cypress Ave