NOT LISTED FOR SALE

2820 Chamonix Dr Cumming, GA 30041

Estimated Value: $453,000 - $493,548

3 Beds
2 Baths
2,151 Sq Ft
$221/Sq Ft Est. Value

Last Sold May 31, 2012

Last sale price $170,500 $79 Per Sq Ft

Est. 179% increase in value since last sale

Current estimated payment $2,830/month

About This Home

As of May 2012

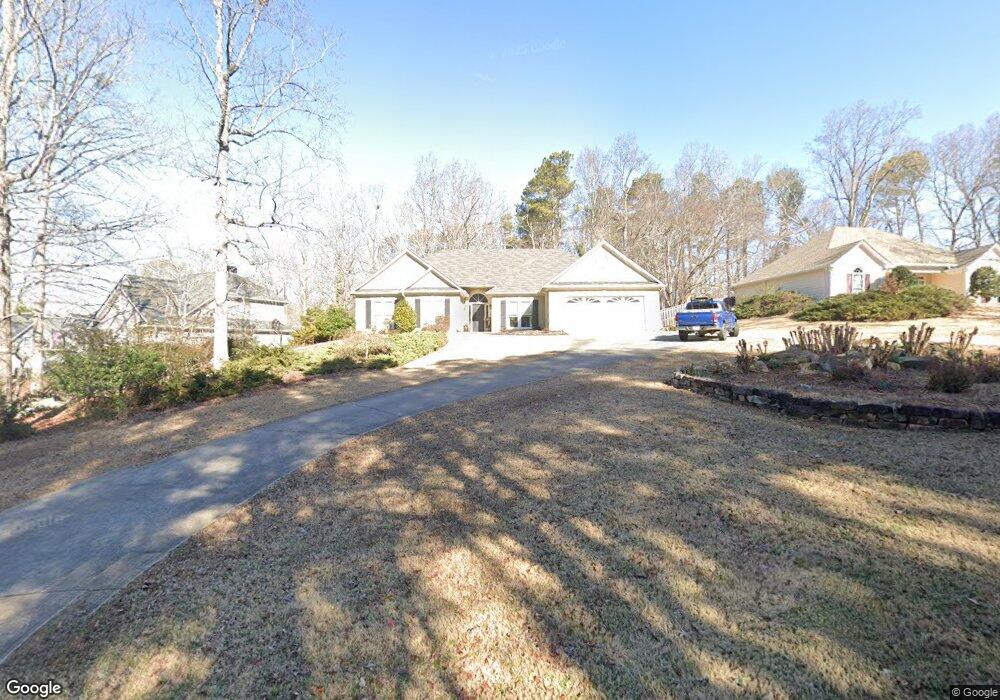
ONE LEVEL LIVING! SPOTLESS HOME ON .59 ACRE PRO LANDSCAPED SITE* VERY OPEN FLOORPLAN WITH LARGE SUNROOM OVERLOOKING PRIVATE BACKYARD* GREAT ENTERTAINING WRAP DECK LEADS TO GAZEBO W/ENCLOSED STORAGE* HOME HAS HARDWOOD FLOORS THROUGHOUT COMMON SPACE, TRAVELINE IN SUNROOM & COZY CARPET IN BEDROOMS* FAMILY ROOM OPEN TO KITCHEN HAS FIREPLACE & CUSTOM CABINETRY* FRENCH DOORS LEADS TO VAULTED SUNROOM.

Ownership History

Date Name Owned For Owner Type

Purchase Details

Listed on
May 1, 2012
Closed on
May 31, 2012
Sold by
Harris Barbara A
Bought by
Williford Ashley E
Seller's Agent
JAYNE WALTERS
NOT A VALID MEMBER
Buyer's Agent
Debi Slabaugh-Ford
Century 21 Results
List Price
$169,900
Sold Price
$170,500
Premium/Discount to List
$600
0.35%
Current Estimated Value
$475,637

Home Financials for this Owner

Home Financials are based on the most recent Mortgage that was taken out on this home.
Estimated Appreciation
$305,137
Avg. Annual Appreciation
8.00%
Original Mortgage
$136,400
Outstanding Balance
$94,574
Interest Rate
3.84%
Mortgage Type
New Conventional
Estimated Equity
$381,063
Source: Public Records

Range of Values:

Collateral Analytics

Collateral Analytics Collateral Analytics AVMs (Automated Valuation Model) employ a number of statistical approaches combined with neighborhood-specific comparable selection guarantees the most up-to-date and precise valuations.

Not Available

Collateral Analytics does not have data for the current month. Please view the chart for historical values.

ICE

ICE Mortgage Technology ICE Mortgage Technology’s AVM (Automated Valuation Model) is a state-of-the-art online residential property valuation tool that provides a quick and accurate estimate of the value of almost any home in the U.S.

Not Available

ICE Mortgage Technology does not have data for the current month. Please view the chart for historical values.

First American

First American First American Data & Analytics’ next-generation AVM combines unrivaled data assets with a blended ensemble of valuation models to produce highly accurate, reliable valuations you can trust.

Not Available

First American does not have data for the current month. Please view the chart for historical values.

Quantarium

Quantarium Quantarium’s valuation service, repeatedly proven the industry’s most accurate and comprehensive, is supercharged with a self-learning and auto-tuning AI engine that continually becomes smarter and more accurate as it processes daily inputs from the industry’s leading RE data lake.

Not Available

Quantarium does not have data for the current month. Please view the chart for historical values.

Average Value
Not Available
List Price
Sold Price
Create a Home Valuation Report for This Property
The Home Valuation Report is an in-depth analysis detailing your home's value as well as a comparison with similar homes in the area

Home Values in the Area

Source: Public Records

Average Home Value in this Area


Source: Public Records

Purchase History

Date Buyer Sale Price Title Company
Williford Ashley E $170,500 --
Source: Public Records

Mortgage History

Date Status Borrower Loan Amount
Open Williford Ashley E $136,400
Source: Public Records

Property History

Date Event Price List to Sale Price per Sq Ft Prior Sale
05/31/2012 05/31/12 Sold $170,500 +0.4% $79 / Sq Ft View Prior Sale
05/03/2012 05/03/12 Pending -- -- --
05/01/2012 05/01/12 For Sale $169,900 -- $79 / Sq Ft

Tax History Compared to Growth

Source: Public Records

Tax History

Year Tax Paid Tax Assessment Tax Assessment Total Assessment is a certain percentage of the fair market value that is determined by local assessors to be the total taxable value of land and additions on the property. Land Improvement
2025 $3,193 $177,652 $72,000 $105,652
2024 $3,193 $162,932 $60,000 $102,932
2023 $2,475 $142,168 $40,000 $102,168
2022 $2,770 $102,580 $20,000 $82,580
2021 $2,481 $102,580 $20,000 $82,580
2020 $2,360 $96,724 $20,000 $76,724
2019 $2,224 $89,988 $20,000 $69,988
2018 $2,123 $84,612 $20,000 $64,612
2017 $2,040 $80,292 $20,000 $60,292
2016 $2,040 $80,292 $20,000 $60,292
2015 $1,800 $68,772 $16,000 $52,772
2014 $1,619 $64,436 $0 $0
Source: Public Records

Agents Affiliated with this Home

  • Section Image
  • Section Image
See All Agents

Map