2820 Cross Country Hill Columbus, GA 31906
Wyntonn Grove NeighborhoodEstimated Value: $275,000 - $377,000
3
Beds
4
Baths
2,454
Sq Ft
$132/Sq Ft
Est. Value
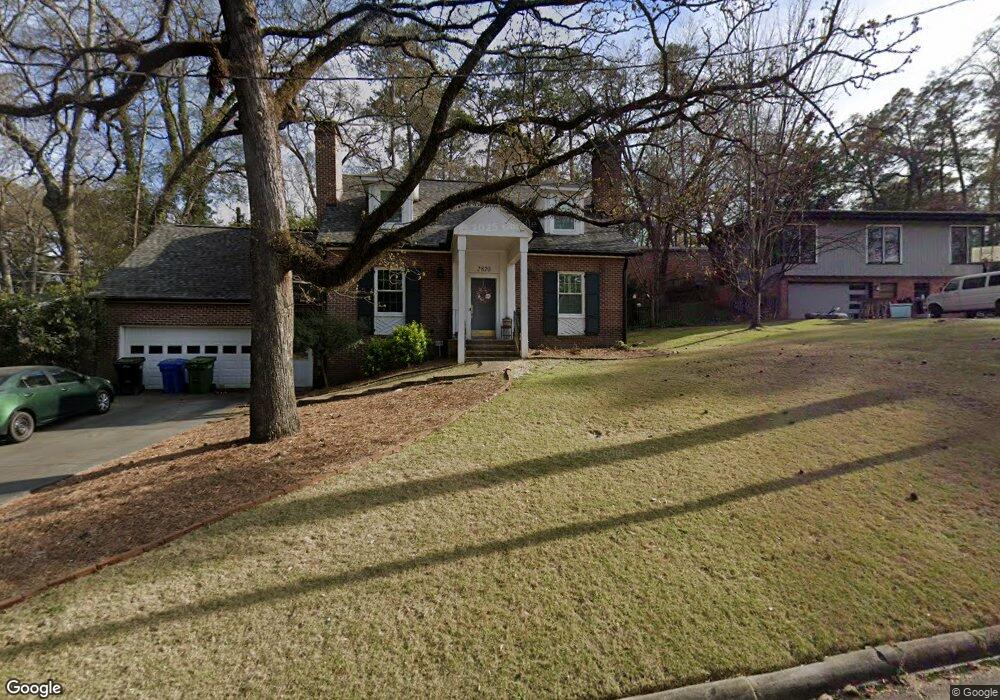
About This Home
This home is located at 2820 Cross Country Hill, Columbus, GA 31906 and is currently estimated at $324,869, approximately $132 per square foot. 2820 Cross Country Hill is a home located in Muscogee County with nearby schools including Clubview Elementary School, Richards Middle School, and Hardaway High School.
Ownership History
Date
Name
Owned For
Owner Type
Purchase Details
Closed on
Jul 17, 2019
Sold by
Maddock Brice
Bought by
Parker Christopher Nicholson and Parker Gabbrielle
Current Estimated Value
Home Financials for this Owner
Home Financials are based on the most recent Mortgage that was taken out on this home.
Original Mortgage
$247,350
Outstanding Balance
$216,611
Interest Rate
3.8%
Mortgage Type
New Conventional
Estimated Equity
$108,258
Purchase Details
Closed on
Jun 3, 2016
Sold by
Peak John R
Bought by
Maddock Brice and Maddock Jaylyn
Home Financials for this Owner
Home Financials are based on the most recent Mortgage that was taken out on this home.
Original Mortgage
$198,800
Interest Rate
3.61%
Purchase Details
Closed on
Sep 24, 2013
Sold by
Peak John R
Bought by
Peak John R and Peak Mary Allison
Home Financials for this Owner
Home Financials are based on the most recent Mortgage that was taken out on this home.
Original Mortgage
$227,200
Interest Rate
4.53%
Create a Home Valuation Report for This Property
The Home Valuation Report is an in-depth analysis detailing your home's value as well as a comparison with similar homes in the area
Home Values in the Area
Average Home Value in this Area
Purchase History
| Date | Buyer | Sale Price | Title Company |
|---|---|---|---|
| Parker Christopher Nicholson | $255,000 | -- | |
| Maddock Brice | $248,500 | -- | |
| Peak John R | -- | -- |
Source: Public Records
Mortgage History
| Date | Status | Borrower | Loan Amount |
|---|---|---|---|
| Open | Parker Christopher Nicholson | $247,350 | |
| Previous Owner | Maddock Brice | $198,800 | |
| Previous Owner | Peak John R | $227,200 |
Source: Public Records
Tax History Compared to Growth
Tax History
| Year | Tax Paid | Tax Assessment Tax Assessment Total Assessment is a certain percentage of the fair market value that is determined by local assessors to be the total taxable value of land and additions on the property. | Land | Improvement |
|---|---|---|---|---|
| 2025 | $2,612 | $102,976 | $17,560 | $85,416 |
| 2024 | $2,611 | $102,976 | $17,560 | $85,416 |
| 2023 | $1,933 | $102,976 | $17,560 | $85,416 |
| 2022 | $2,723 | $90,524 | $17,560 | $72,964 |
| 2021 | $2,716 | $79,908 | $17,560 | $62,348 |
| 2020 | $2,717 | $79,908 | $17,560 | $62,348 |
| 2019 | $2,857 | $83,084 | $17,560 | $65,524 |
| 2018 | $2,857 | $83,084 | $17,560 | $65,524 |
| 2017 | $2,868 | $83,084 | $17,560 | $65,524 |
| 2016 | $3,996 | $110,133 | $16,000 | $94,133 |
| 2015 | $4,001 | $110,133 | $16,000 | $94,133 |
| 2014 | $4,006 | $110,133 | $16,000 | $94,133 |
| 2013 | -- | $110,133 | $16,000 | $94,133 |
Source: Public Records
Map
Nearby Homes
- 2010 Wells Dr
- 1903 Marilon Dr
- 1714 Iris Dr
- 1712 Marilon Dr
- 2604 Sue MacK Dr
- 2817 Carson Dr
- 2637 Sue MacK Dr
- 2940 Birchfield Dr
- 1500 Preston Dr
- 2576 Habersham Ave
- 1706 Stark Ave
- 1700 Stark Ave
- 1806 Stark Ave
- 2911 Gardenia St
- 1513 Wells Dr
- 1717 Stark Ave
- 2916 Gardenia St
- 2533 15th St
- 1809 Carter Ave
- 2609 Hilton Ave
- 2026 Preston Dr
- 2025 Iris Dr
- 2015 Iris Dr
- 2018 Preston Dr
- 2007 Iris Dr
- 2012 Preston Dr
- 2027 Preston Dr
- 2006 Preston Dr
- 2020 Iris Dr
- 2001 Iris Dr
- 2028 Iris Dr
- 2107 Preston Dr
- 2015 Preston Dr
- 2012 Iris Dr
- 0 Preston Dr Unit 187977
- 0 Preston Dr Unit 7374196
- 0 Preston Dr Unit 8525062
- 0 Preston Dr Unit 8316599
- 0 Preston Dr Unit 8559347
- 0 Preston Dr Unit 8222024