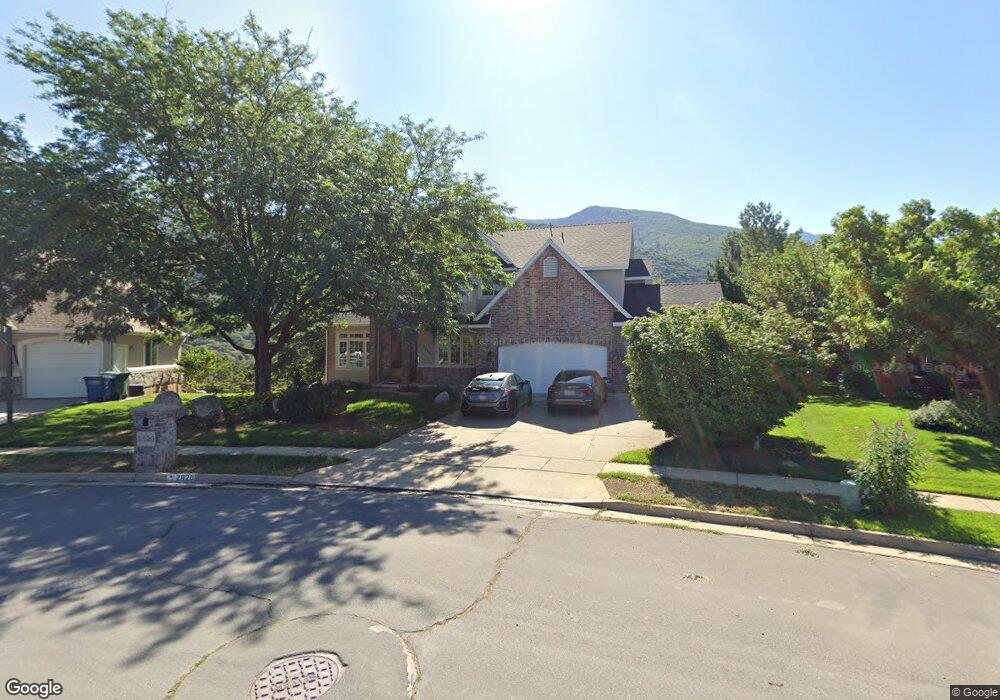
2820 E 3725 N Layton, UT 84040
Estimated Value: $750,000 - $797,000
4
Beds
3
Baths
4,361
Sq Ft
$177/Sq Ft
Est. Value
About This Home
This home is located at 2820 E 3725 N, Layton, UT 84040 and is currently estimated at $770,594, approximately $176 per square foot. 2820 E 3725 N is a home located in Davis County with nearby schools including Mountain View Elementary School, North Layton Junior High School, and Northridge High School.
Ownership History
Date
Name
Owned For
Owner Type
Purchase Details
Closed on
Jun 15, 2023
Sold by
Rush Robert S and Rush Susan L
Bought by
Gibbs Richard W and Gibbs Robin R
Current Estimated Value
Home Financials for this Owner
Home Financials are based on the most recent Mortgage that was taken out on this home.
Original Mortgage
$722,996
Outstanding Balance
$702,892
Interest Rate
6.39%
Mortgage Type
VA
Estimated Equity
$67,702
Purchase Details
Closed on
Sep 13, 2022
Sold by
Gibbs Richard W
Bought by
Richard W And Robin R Gibbs Revocable Living
Purchase Details
Closed on
Oct 16, 2017
Sold by
Rush Robert S and Rush Susan L
Bought by
Rush Robert Steve and Rush Susan L
Purchase Details
Closed on
Jan 22, 1998
Sold by
Rush Robert S and Rush Susan L
Bought by
Rush Robert S and Rush Susan L
Home Financials for this Owner
Home Financials are based on the most recent Mortgage that was taken out on this home.
Original Mortgage
$270,000
Interest Rate
7.25%
Create a Home Valuation Report for This Property
The Home Valuation Report is an in-depth analysis detailing your home's value as well as a comparison with similar homes in the area
Home Values in the Area
Average Home Value in this Area
Purchase History
We collect this data history from publicly available records. To have your information removed, we recommend requesting removal directly through your county’s website.
| Date | Buyer | Sale Price | Title Company |
|---|---|---|---|
| Gibbs Richard W | -- | Stewart Title | |
| Richard W And Robin R Gibbs Revocable Living | -- | Stewart Title | |
| Rush Robert Steve | -- | -- | |
| Rush Robert S | -- | Associated Title Company |
Source: Public Records
Mortgage History
We collect this data history from publicly available records. To have your information removed, we recommend requesting removal directly through your county’s website.
| Date | Status | Borrower | Loan Amount |
|---|---|---|---|
| Open | Gibbs Richard W | $722,996 | |
| Previous Owner | Rush Robert S | $270,000 |
Source: Public Records
Tax History
| Year | Tax Paid | Tax Assessment Tax Assessment Total Assessment is a certain percentage of the fair market value that is determined by local assessors to be the total taxable value of land and additions on the property. | Land | Improvement |
|---|---|---|---|---|
| 2025 | $1,416 | $441,621 | $342,482 | $99,139 |
| 2024 | $1,564 | $432,732 | $349,270 | $83,462 |
| 2023 | $4,691 | $701,000 | $343,845 | $357,155 |
| 2022 | $4,847 | $403,151 | $182,881 | $220,270 |
| 2021 | $4,188 | $513,000 | $252,353 | $260,647 |
| 2020 | $3,895 | $454,000 | $237,330 | $216,670 |
| 2019 | $3,815 | $437,000 | $225,712 | $211,288 |
| 2018 | $3,548 | $404,000 | $226,639 | $177,361 |
| 2016 | $3,575 | $237,886 | $109,705 | $128,181 |
| 2015 | $3,225 | $202,026 | $109,705 | $92,321 |
| 2014 | $3,324 | $214,160 | $95,396 | $118,764 |
| 2013 | -- | $203,525 | $79,378 | $124,147 |
Source: Public Records
Map
Nearby Homes
- 3778 N 2675 E
- 8271 S 2600 E
- 2860 E 3575 N
- 8230 Deer Run Way
- 2455 E 3750 N
- 8149 S 2425 E
- 2273 E 8300 S
- 3297 N Layton Ridge Dr
- 3532 N Layton Ridge Dr
- 2440 Deer Run Dr
- 2357 E 8100 S
- 7897 S 2700 E Unit 303
- 7897 S 2700 E Unit 305
- 2765 E 7825 S
- 2204 E 3225 N
- 7886 S 2100 E
- 3350 N Osprey Way
- 1987 Cedar Bench Dr
- 1969 Cedar Bench Dr
- 2144 E 3000 N
Your Personal Tour Guide
Ask me questions while you tour the home.