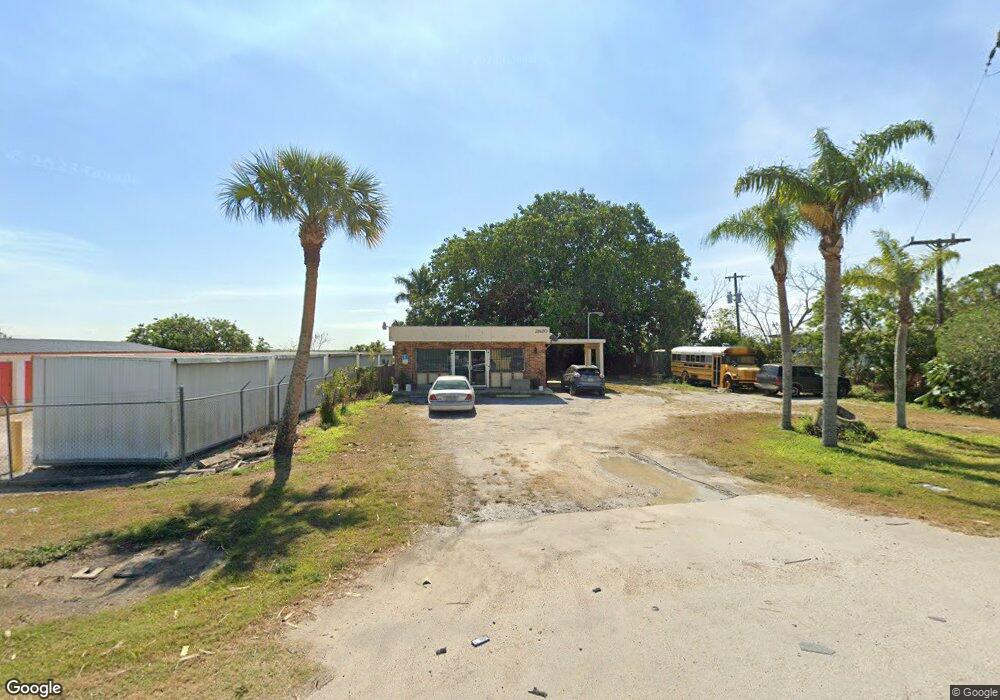
2820 E Main St Pahokee, FL 33476
Estimated Value: $140,932
Studio
5
Baths
1,392
Sq Ft
$101/Sq Ft
Est. Value
About This Home
This home is located at 2820 E Main St, Pahokee, FL 33476 and is currently estimated at $140,932, approximately $101 per square foot. 2820 E Main St is a home located in Palm Beach County with nearby schools including K.E. Cunningham/Canal Point Elementary School, Pahokee Middle/Senior High School, and The Shepherd's School.
Ownership History
Date
Name
Owned For
Owner Type
Purchase Details
Closed on
May 17, 2017
Sold by
Save A Buck Storage Llc
Bought by
Afka Enterprises Inc
Current Estimated Value
Home Financials for this Owner
Home Financials are based on the most recent Mortgage that was taken out on this home.
Original Mortgage
$37,500
Outstanding Balance
$31,036
Interest Rate
4.1%
Mortgage Type
Commercial
Estimated Equity
$109,896
Purchase Details
Closed on
Aug 18, 2005
Sold by
Harrington Joseph A
Bought by
Save A Buck Storage Llc
Purchase Details
Closed on
Aug 1, 1998
Sold by
Bryant Billy H
Bought by
Harrington Ii Joseph A
Home Financials for this Owner
Home Financials are based on the most recent Mortgage that was taken out on this home.
Original Mortgage
$42,500
Interest Rate
6.94%
Mortgage Type
Commercial
Create a Home Valuation Report for This Property
The Home Valuation Report is an in-depth analysis detailing your home's value as well as a comparison with similar homes in the area
Home Values in the Area
Average Home Value in this Area
Purchase History
| Date | Buyer | Sale Price | Title Company |
|---|---|---|---|
| Afka Enterprises Inc | $75,000 | All Country Title Agcy Inc | |
| Save A Buck Storage Llc | $80,000 | Prestige Title Agency Inc | |
| Harrington Ii Joseph A | $50,000 | -- |
Source: Public Records
Mortgage History
| Date | Status | Borrower | Loan Amount |
|---|---|---|---|
| Open | Afka Enterprises Inc | $37,500 | |
| Previous Owner | Harrington Ii Joseph A | $42,500 |
Source: Public Records
Tax History
| Year | Tax Paid | Tax Assessment Tax Assessment Total Assessment is a certain percentage of the fair market value that is determined by local assessors to be the total taxable value of land and additions on the property. | Land | Improvement |
|---|---|---|---|---|
| 2025 | $2,810 | $110,147 | -- | -- |
| 2024 | $2,810 | $100,612 | -- | -- |
| 2023 | $2,861 | $102,862 | $25,395 | $77,467 |
| 2022 | $2,710 | $94,368 | -- | -- |
Source: Public Records
Map
Nearby Homes
- 1697 E Main St
- 12537 Lakeshore Dr
- 501 W Baines Terrace
- 360 Kismet Ave
- 700 Larrimore Rd
- 334 S Barfield Hwy
- 176 Bacom Point Rd
- 197 W Main St
- 297 E 4th St
- 875 Joe Louis Ave
- 170 Apple Ave
- 1450 Muck City Rd
- 263 Carissa Dr
- 0 Rardin Ave
- 0 W Martin Luther King jr Blvd Unit R10990459
- 13348 US Highway 441
- * S Lake Ave
- 636 S Lake Ave
- 1221 Bacom Point Rd
- 00 Bacom Point Rd
- 2980 E Main St
- 2812 E Main St
- 0 E Main St Unit R10431283
- 0 E Main St Unit R10320385
- 0 E Main St Unit R10370546
- 0 E Main St Unit R10514984
- 0 E Main St Unit 803623
- 2701 E Main St
- 1030 N State Market Rd
- 1090 N State Market Rd
- 2576 E Main St
- 2575 E Main St
- 2570 E Main St
- 2560 E Main St
- 2501 E Main St
- 2500 E Main St
- 2481 E Main St
- 2459 E Main St
- 2466 E Main St
- 2443 E Main St
Your Personal Tour Guide
Ask me questions while you tour the home.