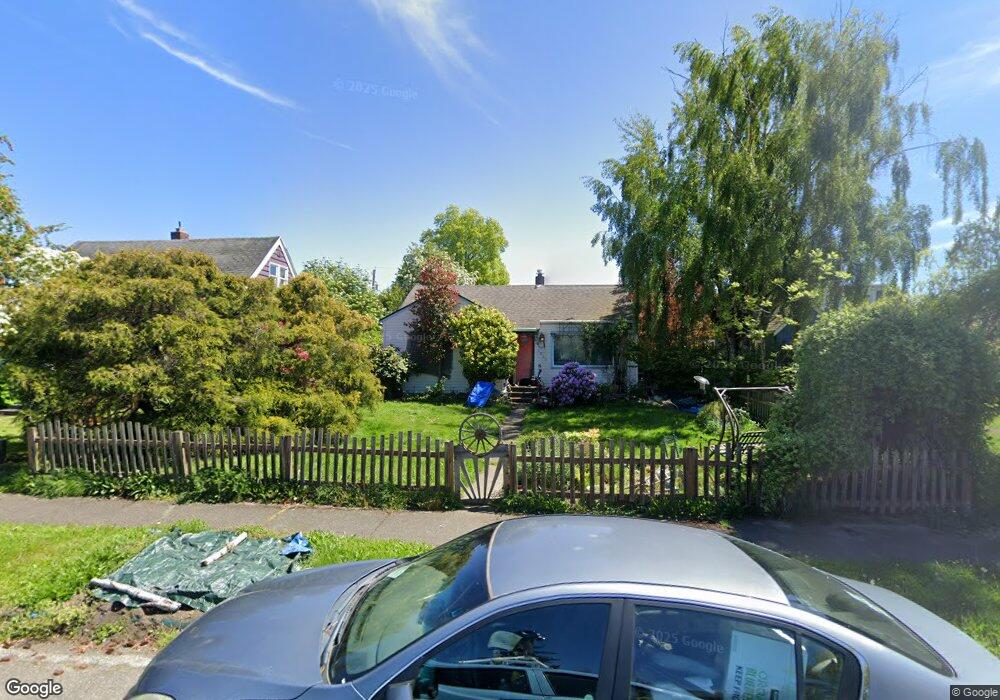
2820 Grant St Bellingham, WA 98225
Sunnyland NeighborhoodEstimated Value: $526,186 - $604,000
2
Beds
1
Bath
1,020
Sq Ft
$550/Sq Ft
Est. Value
About This Home
This home is located at 2820 Grant St, Bellingham, WA 98225 and is currently estimated at $561,047, approximately $550 per square foot. 2820 Grant St is a home located in Whatcom County with nearby schools including Sunnyland Elementary School, Whatcom Middle School, and Bellingham High School.
Create a Home Valuation Report for This Property
The Home Valuation Report is an in-depth analysis detailing your home's value as well as a comparison with similar homes in the area
Home Values in the Area
Average Home Value in this Area
Tax History Compared to Growth
Tax History
| Year | Tax Paid | Tax Assessment Tax Assessment Total Assessment is a certain percentage of the fair market value that is determined by local assessors to be the total taxable value of land and additions on the property. | Land | Improvement |
|---|---|---|---|---|
| 2024 | $391 | $494,275 | $261,698 | $232,577 |
| 2023 | $391 | $506,830 | $268,345 | $238,485 |
| 2022 | $744 | $436,930 | $231,336 | $83,449 |
| 2021 | $528 | $346,770 | $183,600 | $83,449 |
| 2020 | $548 | $321,083 | $170,000 | $151,083 |
| 2019 | $582 | $305,267 | $159,715 | $145,552 |
| 2018 | $618 | $274,032 | $143,395 | $130,637 |
| 2017 | $654 | $235,932 | $123,456 | $112,476 |
| 2016 | $694 | $212,469 | $110,784 | $101,685 |
| 2015 | $724 | $205,172 | $101,184 | $103,988 |
| 2014 | -- | $194,660 | $96,000 | $98,660 |
| 2013 | -- | $200,153 | $92,400 | $107,753 |
Source: Public Records
Map
Nearby Homes
- 2935 King St
- 2432 Grant St
- 2500 Cornwall Ave
- 2111 Franklin St
- 2312 Orleans St
- 1735 Sunup Loop
- 1737 Sunup Loop
- 1733 Sunup Loop
- 2019 Cornwall Ave
- 1712 Sunup Loop
- 1714 Sunup Loop
- 1716 Sunup Loop
- 3008 Meridian St
- 2500 Meridian St
- 804 Gilbert Dr
- 3018 Elm St
- 2600 Elm St
- 1800 J St
- 1724 Iron St
- 2330 Verona St
- 2816 Grant St
- 2824 Grant St
- 2812 Grant St
- 2830 Grant St
- 2806 Grant St
- 2815 Humboldt St
- 2825 Humboldt St
- 2811 Humboldt St
- 2838 Grant St
- 2835 Humboldt St
- 2809 Humboldt St
- 501 E Maryland St
- 509 E Maryland St
- 2817 Grant St
- 2821 Grant St
- 2815 Grant St
- 2801 Humboldt St
- 2839 Humboldt St
- 2809 Grant St
- 2829 Grant St