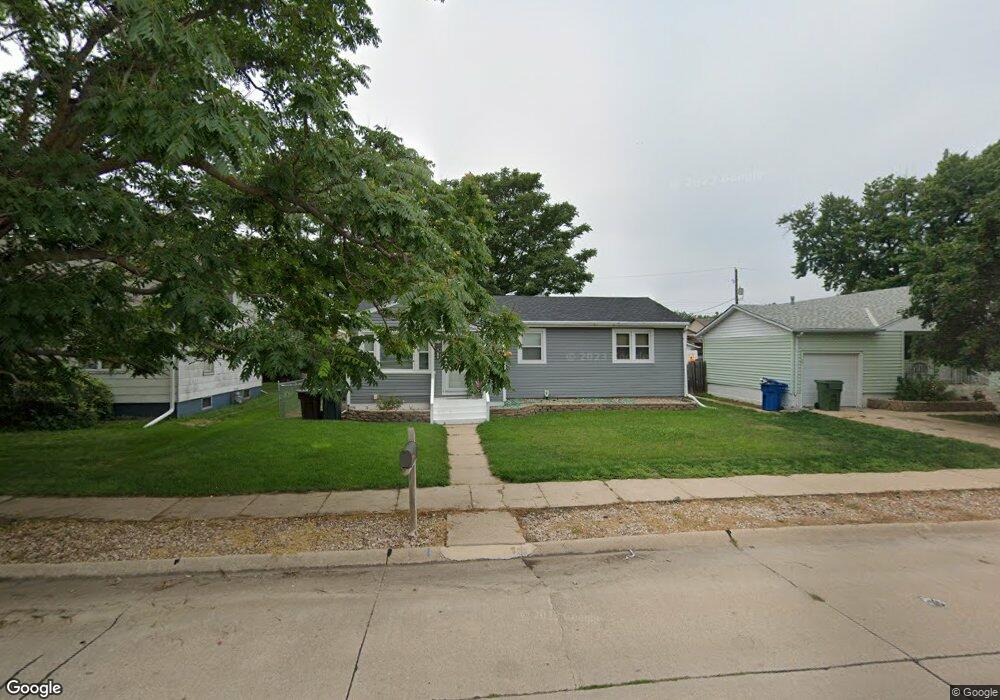
2820 I Ave Kearney, NE 68847
Estimated Value: $208,443 - $233,000
3
Beds
1
Bath
1,062
Sq Ft
$208/Sq Ft
Est. Value
About This Home
This home is located at 2820 I Ave, Kearney, NE 68847 and is currently estimated at $220,611, approximately $207 per square foot. 2820 I Ave is a home located in Buffalo County with nearby schools including Emerson Elementary School, Sunrise Middle School, and Kearney Senior High School.
Ownership History
Date
Name
Owned For
Owner Type
Purchase Details
Closed on
May 22, 2013
Sold by
Grady Jack L
Bought by
Freeman Morgan L
Current Estimated Value
Home Financials for this Owner
Home Financials are based on the most recent Mortgage that was taken out on this home.
Original Mortgage
$114,715
Outstanding Balance
$81,032
Interest Rate
3.41%
Estimated Equity
$139,579
Purchase Details
Closed on
Jul 8, 2011
Sold by
Seacrest Natasha B and Seacrest Jay S
Bought by
Grady Jack L
Create a Home Valuation Report for This Property
The Home Valuation Report is an in-depth analysis detailing your home's value as well as a comparison with similar homes in the area
Home Values in the Area
Average Home Value in this Area
Purchase History
| Date | Buyer | Sale Price | Title Company |
|---|---|---|---|
| Freeman Morgan L | $119,500 | Barney | |
| Grady Jack L | $120,500 | Barney |
Source: Public Records
Mortgage History
| Date | Status | Borrower | Loan Amount |
|---|---|---|---|
| Open | Freeman Morgan L | $114,715 |
Source: Public Records
Tax History Compared to Growth
Tax History
| Year | Tax Paid | Tax Assessment Tax Assessment Total Assessment is a certain percentage of the fair market value that is determined by local assessors to be the total taxable value of land and additions on the property. | Land | Improvement |
|---|---|---|---|---|
| 2025 | $2,220 | $201,850 | $37,225 | $164,625 |
| 2024 | $2,220 | $167,860 | $36,140 | $131,720 |
| 2023 | $2,701 | $158,730 | $36,140 | $122,590 |
| 2022 | $2,588 | $147,485 | $35,490 | $111,995 |
| 2021 | $2,419 | $140,255 | $36,310 | $103,945 |
| 2020 | $2,423 | $140,100 | $36,155 | $103,945 |
| 2019 | $2,417 | $138,020 | $35,980 | $102,040 |
| 2018 | $2,234 | $129,425 | $31,790 | $97,635 |
| 2017 | $2,344 | $136,730 | $31,790 | $104,940 |
| 2016 | $2,325 | $136,730 | $31,790 | $104,940 |
| 2015 | $2,051 | $117,890 | $0 | $0 |
| 2014 | $2,156 | $113,085 | $0 | $0 |
Source: Public Records
Map
Nearby Homes