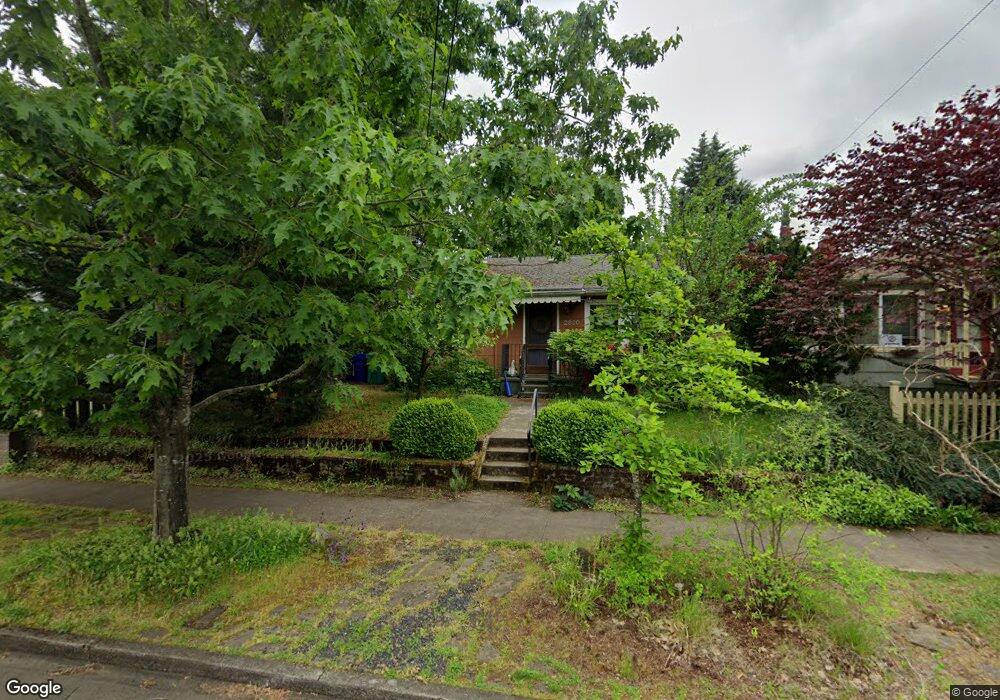
2820 N Terry St Portland, OR 97217
Kenton NeighborhoodEstimated Value: $411,000 - $498,000
3
Beds
1
Bath
920
Sq Ft
$475/Sq Ft
Est. Value
About This Home
This home is located at 2820 N Terry St, Portland, OR 97217 and is currently estimated at $437,280, approximately $475 per square foot. 2820 N Terry St is a home located in Multnomah County with nearby schools including Peninsula Elementary School, Ockley Green, and Jefferson High School.
Ownership History
Date
Name
Owned For
Owner Type
Purchase Details
Closed on
Oct 1, 2008
Sold by
Hutasangkas Chalin J
Bought by
Watson Jonathan and Watson Caroline
Current Estimated Value
Home Financials for this Owner
Home Financials are based on the most recent Mortgage that was taken out on this home.
Original Mortgage
$169,957
Interest Rate
6.43%
Mortgage Type
Purchase Money Mortgage
Purchase Details
Closed on
Apr 15, 2003
Sold by
Wallace Timothy
Bought by
Hutasangkas Chalin J and Hutasangkas Chananda
Home Financials for this Owner
Home Financials are based on the most recent Mortgage that was taken out on this home.
Original Mortgage
$116,700
Interest Rate
5.6%
Mortgage Type
Purchase Money Mortgage
Purchase Details
Closed on
Jan 18, 2000
Sold by
Hud
Bought by
Wallace Timothy and Wallace Debra
Home Financials for this Owner
Home Financials are based on the most recent Mortgage that was taken out on this home.
Original Mortgage
$61,650
Interest Rate
4.35%
Mortgage Type
Purchase Money Mortgage
Purchase Details
Closed on
May 21, 1996
Sold by
Umpqua Beach Resort Inc
Bought by
Wardropper Christopher S
Home Financials for this Owner
Home Financials are based on the most recent Mortgage that was taken out on this home.
Original Mortgage
$71,984
Interest Rate
7.97%
Mortgage Type
FHA
Purchase Details
Closed on
Nov 8, 1995
Sold by
Real Estate Exchange Inc
Bought by
Umpqua Beach Resort Inc
Purchase Details
Closed on
Jun 26, 1995
Sold by
Resources Northwest Inc
Bought by
Real Estate Exchange Inc
Purchase Details
Closed on
Feb 9, 1995
Sold by
Naglee Dominic
Bought by
Resources Northwest Inc
Purchase Details
Closed on
Feb 2, 1995
Sold by
Summers Lloyd R
Bought by
Resources Northwest Inc
Purchase Details
Closed on
Jan 31, 1995
Sold by
Penner Carol
Bought by
Resources Northwest Inc
Create a Home Valuation Report for This Property
The Home Valuation Report is an in-depth analysis detailing your home's value as well as a comparison with similar homes in the area
Home Values in the Area
Average Home Value in this Area
Purchase History
| Date | Buyer | Sale Price | Title Company |
|---|---|---|---|
| Watson Jonathan | $199,950 | Chicago Title Insurance Co | |
| Hutasangkas Chalin J | $120,400 | Ticor Title Insurance Compan | |
| Wallace Timothy | $77,101 | Oregon Title Insurance Co | |
| Wardropper Christopher S | $72,000 | Chicago Title | |
| Umpqua Beach Resort Inc | -- | Chicago Title Insurance Co | |
| Real Estate Exchange Inc | $71,000 | Chicago Title | |
| Resources Northwest Inc | $71,000 | Chicago Title | |
| Resources Northwest Inc | -- | -- | |
| Resources Northwest Inc | $39,000 | Chicago Title Insurance | |
| Resources Northwest Inc | -- | -- | |
| Resources Northwest Inc | $40,000 | -- |
Source: Public Records
Mortgage History
| Date | Status | Borrower | Loan Amount |
|---|---|---|---|
| Previous Owner | Watson Jonathan | $169,957 | |
| Previous Owner | Hutasangkas Chalin J | $116,700 | |
| Previous Owner | Wallace Timothy | $61,650 | |
| Previous Owner | Wardropper Christopher S | $71,984 |
Source: Public Records
Tax History Compared to Growth
Tax History
| Year | Tax Paid | Tax Assessment Tax Assessment Total Assessment is a certain percentage of the fair market value that is determined by local assessors to be the total taxable value of land and additions on the property. | Land | Improvement |
|---|---|---|---|---|
| 2025 | $3,781 | $140,310 | -- | -- |
| 2024 | $3,645 | $136,230 | -- | -- |
| 2023 | $3,645 | $132,270 | $0 | $0 |
| 2022 | $3,429 | $128,420 | $0 | $0 |
| 2021 | $3,371 | $124,680 | $0 | $0 |
| 2020 | $3,092 | $121,050 | $0 | $0 |
| 2019 | $2,979 | $117,530 | $0 | $0 |
| 2018 | $2,891 | $114,110 | $0 | $0 |
| 2017 | $2,771 | $110,790 | $0 | $0 |
| 2016 | $2,536 | $107,570 | $0 | $0 |
| 2015 | $2,470 | $104,440 | $0 | $0 |
| 2014 | $2,432 | $101,400 | $0 | $0 |
Source: Public Records
Map
Nearby Homes
- 2810 N Watts St
- 2544 N Watts St
- 2538 N Watts St
- 2624 N Kilpatrick St
- 2622 N Kilpatrick St
- 2620 N Kilpatrick St
- 2515 N Winchell St
- 7817 N Delaware Ave
- 8280 N Burrage Ave
- 2504 N Baldwin St
- 3257 N Baldwin St
- 2813 N Argyle St
- 7327 N Oatman Ave
- 7622 N Brandon Ave
- 7214 N Boston Ave
- 7385 N Mobile Ave
- 8802 N Burrage Ave
- 7387 N Mobile Ave
- 7383 N Mobile Ave
- 7379 N Mobile Ave
- 2826 N Terry St
- 2802 N Terry St
- 2728 N Terry St
- 0 W N Terry St
- 2834 W N Terry St
- 2821 N Farragut St
- 2811 N Farragut St
- 2827 N Farragut St
- 2801 N Farragut St
- 2837 N Farragut St
- 2819 N Terry St
- 2725 N Farragut St
- 2720 N Terry St
- 2902 N Terry St
- 2823 N Terry St
- 2807 N Terry St
- 2825 N Terry St
- 2908 N Terry St
- 2712 N Terry St
- 2731 N Terry St