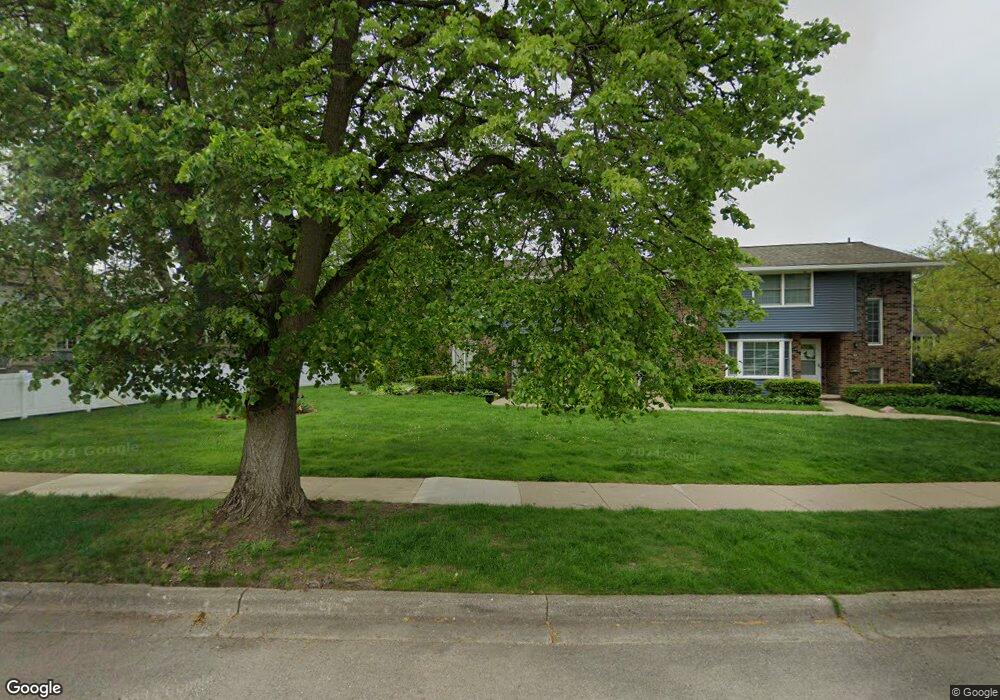
2820 Page Ave Ann Arbor, MI 48104
Georgetown NeighborhoodEstimated Value: $279,934 - $366,000
--
Bed
2
Baths
1,201
Sq Ft
$262/Sq Ft
Est. Value
About This Home
This home is located at 2820 Page Ave, Ann Arbor, MI 48104 and is currently estimated at $315,234, approximately $262 per square foot. 2820 Page Ave is a home located in Washtenaw County with nearby schools including Pattengill Elementary School, Bryant Elementary School, and Tappan Middle School.
Ownership History
Date
Name
Owned For
Owner Type
Purchase Details
Closed on
Dec 12, 2022
Sold by
Lee Te-Nien
Bought by
Lee Te-Nien and Zhang Nan
Current Estimated Value
Purchase Details
Closed on
Oct 19, 2022
Sold by
Zhang Nan and Zhang Te-Nien
Bought by
Zhang Nan and Te-Nien Lee Te-Nien
Purchase Details
Closed on
Feb 12, 2021
Sold by
Castanier Benjamin J
Bought by
Zhang Nan and Lee Te Nien
Purchase Details
Closed on
Jun 16, 2020
Sold by
Castanier William B and Castanier Mary
Bought by
Castanier Benjamin J
Purchase Details
Closed on
Oct 23, 2017
Sold by
Castanier William B and Castanier Mary T
Bought by
Castanier William B and Castanier Mary T
Purchase Details
Closed on
Jun 30, 2004
Sold by
Georgetown Investments Llc
Bought by
Castanier William B and Castanier Mary T
Home Financials for this Owner
Home Financials are based on the most recent Mortgage that was taken out on this home.
Original Mortgage
$115,000
Interest Rate
6.37%
Mortgage Type
Purchase Money Mortgage
Create a Home Valuation Report for This Property
The Home Valuation Report is an in-depth analysis detailing your home's value as well as a comparison with similar homes in the area
Home Values in the Area
Average Home Value in this Area
Purchase History
| Date | Buyer | Sale Price | Title Company |
|---|---|---|---|
| Lee Te-Nien | -- | -- | |
| Zhang Nan | -- | -- | |
| Zhang Nan | $215,000 | None Available | |
| Castanier Benjamin J | -- | None Available | |
| Castanier William B | -- | None Available | |
| Castanier William B | $164,560 | -- |
Source: Public Records
Mortgage History
| Date | Status | Borrower | Loan Amount |
|---|---|---|---|
| Previous Owner | Castanier William B | $115,000 |
Source: Public Records
Tax History Compared to Growth
Tax History
| Year | Tax Paid | Tax Assessment Tax Assessment Total Assessment is a certain percentage of the fair market value that is determined by local assessors to be the total taxable value of land and additions on the property. | Land | Improvement |
|---|---|---|---|---|
| 2025 | $7,230 | $153,900 | $0 | $0 |
| 2024 | $7,032 | $150,300 | $0 | $0 |
| 2023 | $6,493 | $135,300 | $0 | $0 |
| 2022 | $7,859 | $118,400 | $0 | $0 |
| 2021 | $3,138 | $117,100 | $0 | $0 |
| 2020 | $3,511 | $110,400 | $0 | $0 |
| 2019 | $3,765 | $95,800 | $95,800 | $0 |
| 2018 | $3,694 | $85,100 | $0 | $0 |
| 2017 | $3,563 | $85,400 | $0 | $0 |
| 2016 | $3,472 | $56,115 | $0 | $0 |
| 2015 | $3,329 | $55,948 | $0 | $0 |
| 2014 | $3,329 | $54,200 | $0 | $0 |
| 2013 | -- | $54,200 | $0 | $0 |
Source: Public Records
Map
Nearby Homes
- 2434 Mulberry Ct Unit 22A
- 3212 Lockridge Dr
- 2411 Packard St Unit 53E
- 3230 Alpine Dr Unit 45
- 3300 Alpine Dr Unit 10
- 3320 Alpine Dr
- 3322 Alpine Dr
- 2106 Camelot Rd
- 3057 Forest Creek Ct Unit 23
- 2219 Needham Rd
- 2115 Nature Cove Ct Unit 206
- 1709 South Blvd
- 2125 Nature Cove Ct Unit 108
- 2236 Medford Rd
- 1704 Shadford Rd
- 11 Metroview Ct
- 2316 Brockman Blvd
- 12 Trowbridge Ct
- 2731 Canterbury Rd
- 275 Briarcrest Dr Unit 185
- 2820 Page Ave Unit 27
- 2818 Page Ave
- 2816 Page Ave Unit 29
- 2774 Page Ave
- 2776 Page Ave
- 2814 Page Ave Unit 30
- 2778 Page Ave Unit 35
- 2782 Page Ave Unit 44
- 2812 Page Ave Unit 31
- 2784 Page Ave Unit 43
- 2780 Page Ave
- 2786 Page Ave
- 2788 Page Ave Unit 41
- 2810 Page Ave Unit 32
- 2832 Page Ave Unit 16
- 2836 Page Ave Unit 14
- 2790 Page Ave Unit 40
- 2830 Page Ave
- 2792 Page Ave
- 2838 Page Ave