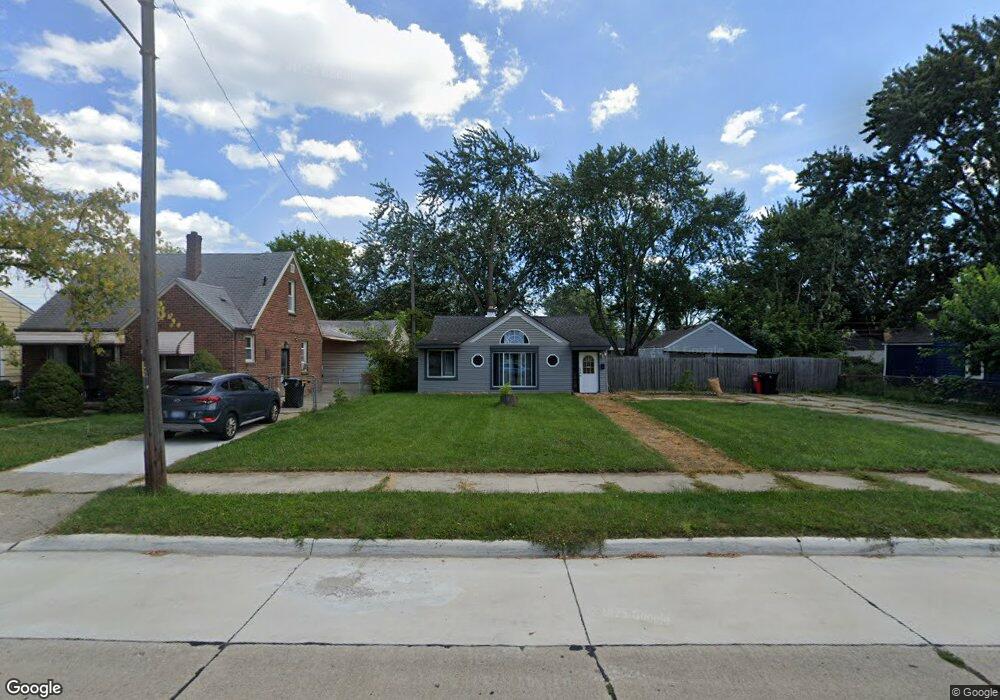
28202 Rosemont St Roseville, MI 48066
Estimated Value: $119,848 - $142,000
2
Beds
1
Bath
860
Sq Ft
$153/Sq Ft
Est. Value
About This Home
This home is located at 28202 Rosemont St, Roseville, MI 48066 and is currently estimated at $131,462, approximately $152 per square foot. 28202 Rosemont St is a home located in Macomb County with nearby schools including Fountain Elementary School, Roseville Middle School, and Eastland Middle School.
Ownership History
Date
Name
Owned For
Owner Type
Purchase Details
Closed on
Nov 28, 2016
Sold by
Anderson Michael H
Bought by
Hughes Anderson M
Current Estimated Value
Purchase Details
Closed on
Oct 27, 2016
Sold by
Petruniak William D and Petruniak Jason Adam
Bought by
Anderson Michael H
Purchase Details
Closed on
Nov 8, 2010
Sold by
Petruniak William D and Petruniak Jason Adam
Bought by
Petruniak William D and Petruniak Jason Adam
Purchase Details
Closed on
Sep 24, 2007
Sold by
Petruniak William D and Petruniak Denise
Bought by
Petruniak William D and Petruniak Jason Adam
Purchase Details
Closed on
Mar 5, 2002
Sold by
Petruniak William D
Bought by
Petruniak William D
Purchase Details
Closed on
Feb 17, 1995
Sold by
Linda M Howard Est
Bought by
William D Petruniak
Home Financials for this Owner
Home Financials are based on the most recent Mortgage that was taken out on this home.
Original Mortgage
$24,800
Interest Rate
8.82%
Mortgage Type
New Conventional
Create a Home Valuation Report for This Property
The Home Valuation Report is an in-depth analysis detailing your home's value as well as a comparison with similar homes in the area
Home Values in the Area
Average Home Value in this Area
Purchase History
| Date | Buyer | Sale Price | Title Company |
|---|---|---|---|
| Hughes Anderson M | -- | None Available | |
| Anderson Michael H | $10,500 | First American Title Ins Co | |
| Petruniak William D | -- | None Available | |
| Petruniak William D | -- | Philip F Greco Title Company | |
| Petruniak William D | -- | -- | |
| William D Petruniak | $31,000 | -- |
Source: Public Records
Mortgage History
| Date | Status | Borrower | Loan Amount |
|---|---|---|---|
| Previous Owner | William D Petruniak | $24,800 |
Source: Public Records
Tax History Compared to Growth
Tax History
| Year | Tax Paid | Tax Assessment Tax Assessment Total Assessment is a certain percentage of the fair market value that is determined by local assessors to be the total taxable value of land and additions on the property. | Land | Improvement |
|---|---|---|---|---|
| 2025 | $1,949 | $57,100 | $0 | $0 |
| 2024 | $1,020 | $50,600 | $0 | $0 |
| 2023 | $977 | $44,400 | $0 | $0 |
| 2022 | $1,747 | $37,600 | $0 | $0 |
| 2021 | $1,695 | $33,600 | $0 | $0 |
| 2020 | $738 | $31,800 | $0 | $0 |
| 2019 | $971 | $27,700 | $0 | $0 |
| 2018 | $1,113 | $0 | $0 | $0 |
| 2017 | $1,921 | $20,872 | $8,254 | $12,618 |
| 2016 | $971 | $20,872 | $0 | $0 |
| 2015 | $832 | $21,017 | $0 | $0 |
| 2013 | -- | $20,026 | $0 | $0 |
| 2011 | -- | $23,082 | $0 | $0 |
Source: Public Records
Map
Nearby Homes
- 27250 Edward St
- 28222 Bohn St
- 28319 Waverly St
- 27639 Bohn St
- 28410 Bohn St
- 28212 Floral St
- 17484 Lowell St
- 28320 Hillview St
- 28511 Hillview St
- 28703 Groveland St
- 27503 Edward St
- 28824 Bohn St
- 28741 Essex St
- 28767 Maple St
- Vacant Hillview Hillview St
- 17631 Roseville Blvd
- 28908 Maple St
- 28919 Essex St
- 17980 Homer St
- 27766 Eastwick Square
- 28088 Rosemont St
- 28210 Rosemont St
- 28080 Rosemont St
- 28222 Rosemont St
- 28203 Waverly St
- 28099 Waverly St
- 28211 Waverly St
- 0000 Homer St
- 28203 Rosemont St
- 28228 Rosemont St
- 28085 Waverly St
- 28171 Rosemont St
- 28219 Waverly St
- 28209 Rosemont St
- 28089 Rosemont St
- 28073 Waverly St
- 28068 Rosemont St
- 28236 Rosemont St
- 28221 Rosemont St
- 28081 Rosemont St Unit Bldg-Unit