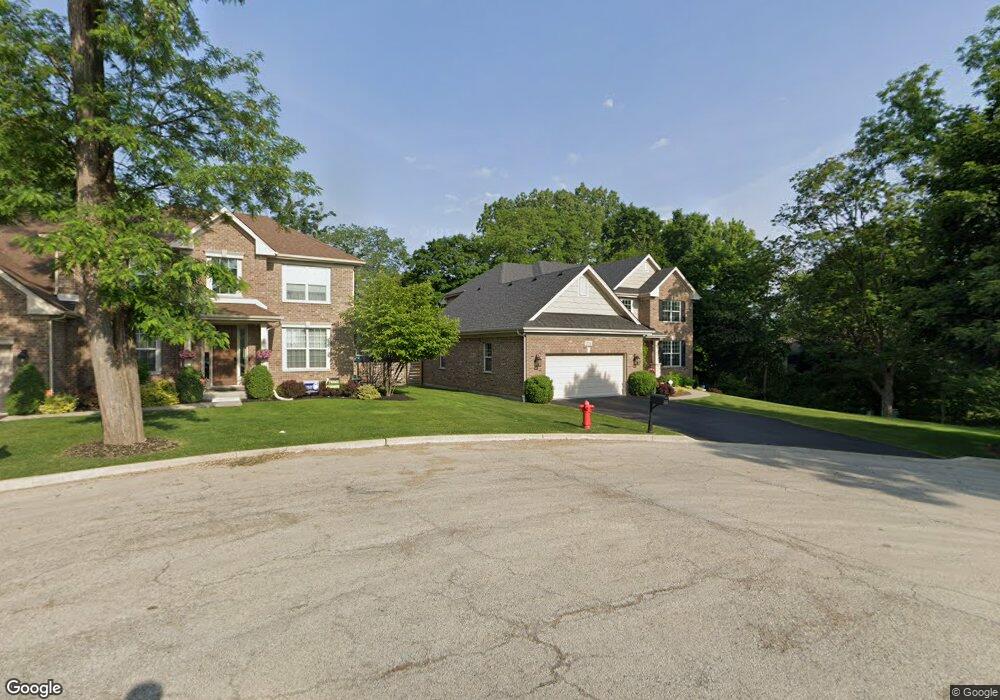
2821 Cole Ct Rolling Meadows, IL 60008
Creekside NeighborhoodEstimated Value: $717,000 - $794,000
4
Beds
3
Baths
3,140
Sq Ft
$245/Sq Ft
Est. Value
About This Home
This home is located at 2821 Cole Ct, Rolling Meadows, IL 60008 and is currently estimated at $769,566, approximately $245 per square foot. 2821 Cole Ct is a home located in Cook County with nearby schools including Central Road Elementary School, Plum Grove Jr High School, and William Fremd High School.
Ownership History
Date
Name
Owned For
Owner Type
Purchase Details
Closed on
Mar 15, 2017
Sold by
Cole Court Llc
Bought by
Kielbasa Michael and Losurdo Angelica
Current Estimated Value
Home Financials for this Owner
Home Financials are based on the most recent Mortgage that was taken out on this home.
Original Mortgage
$420,000
Outstanding Balance
$345,967
Interest Rate
4.19%
Mortgage Type
New Conventional
Estimated Equity
$423,599
Purchase Details
Closed on
Dec 28, 2012
Sold by
Associated Bank Na
Bought by
Cole Court Llc
Purchase Details
Closed on
Jun 15, 2012
Sold by
Paweleck Joseph J and Paweleck Joseph J
Bought by
Associated Bank National Association
Create a Home Valuation Report for This Property
The Home Valuation Report is an in-depth analysis detailing your home's value as well as a comparison with similar homes in the area
Home Values in the Area
Average Home Value in this Area
Purchase History
| Date | Buyer | Sale Price | Title Company |
|---|---|---|---|
| Kielbasa Michael | $525,000 | None Available | |
| Kielbasa Michael | $525,000 | None Available | |
| Cole Court Llc | $125,000 | None Available | |
| Cole Court Llc | $125,000 | None Available | |
| Associated Bank National Association | -- | None Available | |
| Associated Bank National Association | -- | None Available |
Source: Public Records
Mortgage History
| Date | Status | Borrower | Loan Amount |
|---|---|---|---|
| Open | Kielbasa Michael | $420,000 |
Source: Public Records
Tax History
| Year | Tax Paid | Tax Assessment Tax Assessment Total Assessment is a certain percentage of the fair market value that is determined by local assessors to be the total taxable value of land and additions on the property. | Land | Improvement |
|---|---|---|---|---|
| 2025 | $16,729 | $81,000 | $9,950 | $71,050 |
| 2024 | $16,729 | $56,304 | $8,419 | $47,885 |
| 2023 | $17,199 | $60,000 | $8,419 | $51,581 |
| 2022 | $17,199 | $60,000 | $8,419 | $51,581 |
| 2021 | $14,924 | $46,987 | $5,357 | $41,630 |
| 2020 | $14,764 | $46,987 | $5,357 | $41,630 |
| 2019 | $14,838 | $52,500 | $5,357 | $47,143 |
| 2018 | $16,427 | $52,500 | $4,974 | $47,526 |
| 2017 | $17,217 | $52,500 | $4,974 | $47,526 |
| 2016 | $14,312 | $46,889 | $4,974 | $41,915 |
| 2015 | $1,498 | $4,592 | $4,592 | $0 |
| 2014 | $1,466 | $4,592 | $4,592 | $0 |
| 2013 | $1,430 | $4,592 | $4,592 | $0 |
Source: Public Records
Map
Nearby Homes
- 2600 Brookwood Way Dr Unit 316
- 2650 Brookwood Way Dr Unit 313
- 2650 Brookwood Way Dr Unit 108
- 3806 Ashley Ct
- 3 Holyoke on Auburn
- 304 E Tall Trees Ln
- 3000 California Ave
- 2401 Rohlwing Rd
- 3345 Kirchoff Rd Unit 5C
- 3265 Kirchoff Rd Unit 116
- 2302 Flicker Ln
- 399 Knollwood Ct
- 86 Brookdale Ln
- 3135 Town Square Dr Unit 401
- 3135 Town Square Dr Unit 104
- 3100 Town Square Dr Unit 308
- 3100 Town Square Dr Unit 204
- 2 Croydon on Duxbury
- 3200 Thrush Ln
- 4795 Woodcliff Ln
- 2821 Cole Ct
- 2851 Cole Ct
- 2851 Cole Ct
- 4103 Jody Ct
- 4101 Jody Ct
- 2804 Coleen Ct
- 2803 W Frontage Rd
- 4100 Oaksbury Ln
- 4108 Oaksbury Ln
- 2851 Coleen Ct
- 2881 Coleen Ct
- 2881 Cole Ct
- 2881 Cole Ct
- 4116 Oaksbury Ln
- 2851 W Frontage Rd
- 2851 W Frontage Rd
- 2807 Coleen Ct
- 4124 Oaksbury Ln
- 2803 Coleen Ct
- 2805 Coleen Ct
Your Personal Tour Guide
Ask me questions while you tour the home.