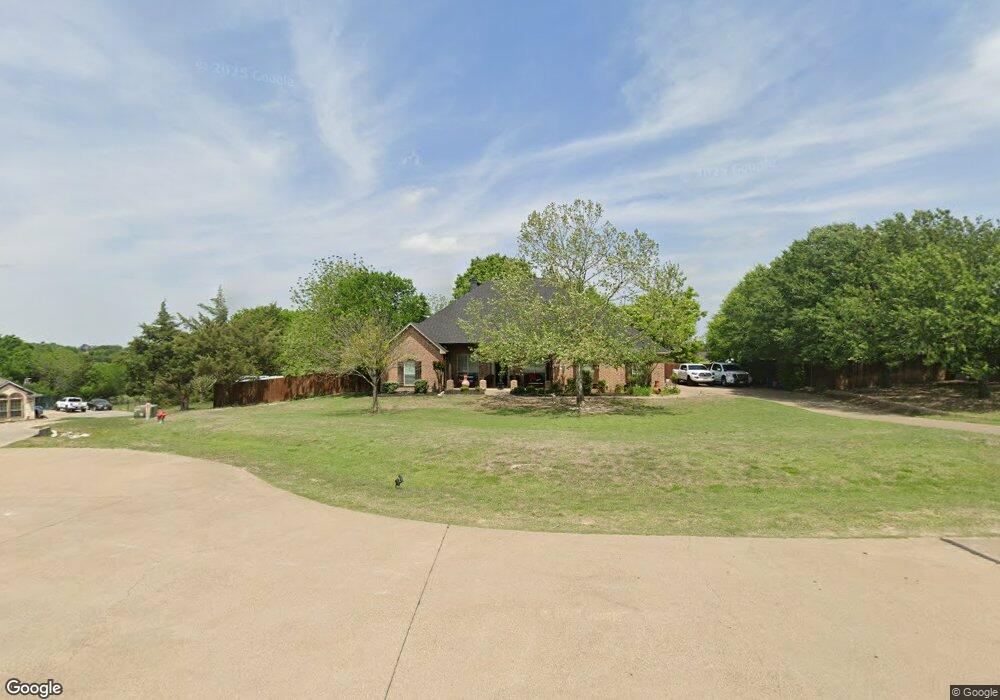
2821 Jaes Ct Midlothian, TX 76065
Estimated Value: $511,000 - $554,929
3
Beds
3
Baths
2,345
Sq Ft
$227/Sq Ft
Est. Value
About This Home
This home is located at 2821 Jaes Ct, Midlothian, TX 76065 and is currently estimated at $532,965, approximately $227 per square foot. 2821 Jaes Ct is a home located in Ellis County with nearby schools including Larue Miller Elementary School and Frank Seale Middle School.
Ownership History
Date
Name
Owned For
Owner Type
Purchase Details
Closed on
Aug 5, 2008
Sold by
Wilson Carolyn G
Bought by
Schultz James Trenton and Schultz Paula Davi
Current Estimated Value
Home Financials for this Owner
Home Financials are based on the most recent Mortgage that was taken out on this home.
Original Mortgage
$184,000
Outstanding Balance
$121,591
Interest Rate
6.47%
Mortgage Type
New Conventional
Estimated Equity
$411,374
Purchase Details
Closed on
Feb 17, 2006
Sold by
Griffin Timothy R and Griffin Julie A
Bought by
Wilson Carolyn G and Marshall Clay B
Home Financials for this Owner
Home Financials are based on the most recent Mortgage that was taken out on this home.
Original Mortgage
$233,600
Interest Rate
6.15%
Mortgage Type
New Conventional
Purchase Details
Closed on
May 27, 2005
Sold by
Griffin Karl R
Bought by
T J Griffin Custom Homes Inc
Purchase Details
Closed on
Jan 18, 2005
Sold by
Marty Griffin Custom
Bought by
Griffin Karl R
Create a Home Valuation Report for This Property
The Home Valuation Report is an in-depth analysis detailing your home's value as well as a comparison with similar homes in the area
Home Values in the Area
Average Home Value in this Area
Purchase History
| Date | Buyer | Sale Price | Title Company |
|---|---|---|---|
| Schultz James Trenton | $230,000 | -- | |
| Wilson Carolyn G | -- | None Available | |
| T J Griffin Custom Homes Inc | -- | None Available | |
| Griffin Karl R | -- | None Available |
Source: Public Records
Mortgage History
| Date | Status | Borrower | Loan Amount |
|---|---|---|---|
| Open | Schultz James Trenton | $184,000 | |
| Previous Owner | Wilson Carolyn G | $233,600 |
Source: Public Records
Tax History Compared to Growth
Tax History
| Year | Tax Paid | Tax Assessment Tax Assessment Total Assessment is a certain percentage of the fair market value that is determined by local assessors to be the total taxable value of land and additions on the property. | Land | Improvement |
|---|---|---|---|---|
| 2025 | $7,094 | $512,435 | -- | -- |
| 2024 | $7,094 | $465,850 | -- | -- |
| 2023 | $7,094 | $423,500 | $0 | $0 |
| 2022 | $8,626 | $385,000 | $0 | $0 |
| 2021 | $8,282 | $350,000 | $70,000 | $280,000 |
| 2020 | $8,804 | $350,000 | $70,000 | $280,000 |
| 2019 | $8,898 | $339,770 | $0 | $0 |
| 2018 | $8,795 | $342,000 | $37,500 | $304,500 |
| 2017 | $6,216 | $302,676 | $37,500 | $265,176 |
| 2016 | $5,851 | $295,000 | $35,000 | $260,000 |
| 2015 | $4,403 | $259,000 | $35,000 | $224,000 |
| 2014 | $4,403 | $245,739 | $0 | $0 |
Source: Public Records
Map
Nearby Homes
- 2610 Jakes Ct
- 3240 Baylor Blvd
- 4641 Plainview Rd
- 3841 Ledgestone Ln
- 3421 Mindy Ln
- 4421 Spring Garden Rd
- 3240 Caleb Ct E
- 3270 Katy Kourt E
- 2250 Whispering Hills Dr
- 3641 Laura Ct
- 3020 Mccarver Dr
- 5051 Monroe Dr
- 3630 Billy Ray Rd
- 3630 Matt Ct
- 3461 Skinner Rd
- 5241 Plainview Rd
- 3291 Plainview Rd
- 3420 Sudith Ln
- 3870 Ledgestone Ln
- 1859 Ashford Ln
- 2831 Jaes Ct
- 2811 Jaes Ct
- 2820 Jaes Ct
- 4241 Morgans Way
- 2801 Jaes Ct
- 2810 Jaes Ct
- 4231 Morgans Way
- 4251 Morgans Way
- 4221 Morgans Way
- 4230 Tracey Ct
- 4281 Morgans Way
- 4260 Morgans Way
- 2811 John t Ln
- 4240 Morgans Way
- 4250 Morgans Way
- 4240 Tracey Ct
- 2691 John t Ln
- xxx Tracey Ct
- 2671 John t Ln
- 2681 John t Ln