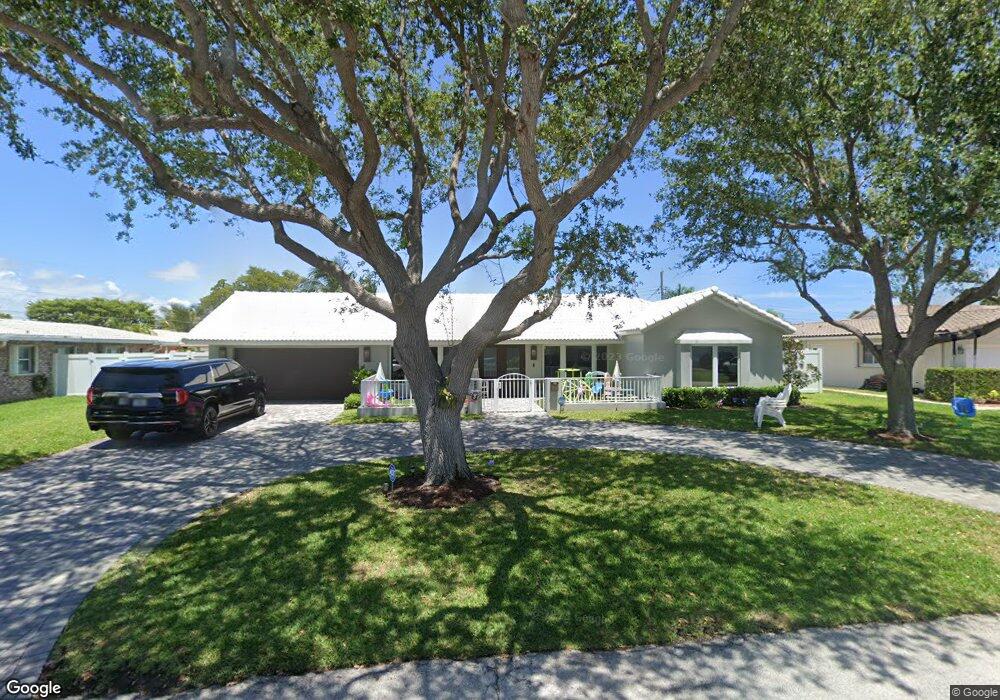
2821 NE 39th Ct Lighthouse Point, FL 33064
Estimated Value: $906,758 - $1,599,000
2
Beds
2
Baths
2,158
Sq Ft
$528/Sq Ft
Est. Value
About This Home
This home is located at 2821 NE 39th Ct, Lighthouse Point, FL 33064 and is currently estimated at $1,138,440, approximately $527 per square foot. 2821 NE 39th Ct is a home located in Broward County with nearby schools including Norcrest Elementary School, Deerfield Beach Middle School, and Deerfield Beach High School.
Ownership History
Date
Name
Owned For
Owner Type
Purchase Details
Closed on
Jun 24, 2022
Sold by
Neil Rosenberg
Bought by
Rosenberg Neil and Rosenberg Jaclyn
Current Estimated Value
Purchase Details
Closed on
Dec 7, 2016
Sold by
Flaten Paul A and Flaten Susan J
Bought by
Roseberg Alison B and Roseberg Neil
Purchase Details
Closed on
Jan 20, 1998
Sold by
Mosling Donald P and Mosling Agnes C
Bought by
Flaten Paul A and Flaten Susan J
Home Financials for this Owner
Home Financials are based on the most recent Mortgage that was taken out on this home.
Original Mortgage
$208,000
Interest Rate
7.16%
Mortgage Type
New Conventional
Purchase Details
Closed on
Jul 1, 1991
Sold by
Available Not
Bought by
Available Not
Create a Home Valuation Report for This Property
The Home Valuation Report is an in-depth analysis detailing your home's value as well as a comparison with similar homes in the area
Home Values in the Area
Average Home Value in this Area
Purchase History
| Date | Buyer | Sale Price | Title Company |
|---|---|---|---|
| Rosenberg Neil | -- | None Listed On Document | |
| Roseberg Alison B | $475,000 | Attorney | |
| Flaten Paul A | $269,000 | -- | |
| Available Not | $240,000 | -- |
Source: Public Records
Mortgage History
| Date | Status | Borrower | Loan Amount |
|---|---|---|---|
| Previous Owner | Flaten Paul A | $208,000 |
Source: Public Records
Tax History Compared to Growth
Tax History
| Year | Tax Paid | Tax Assessment Tax Assessment Total Assessment is a certain percentage of the fair market value that is determined by local assessors to be the total taxable value of land and additions on the property. | Land | Improvement |
|---|---|---|---|---|
| 2025 | $14,249 | $762,980 | -- | -- |
| 2024 | $13,704 | $741,480 | $107,160 | $612,730 |
| 2023 | $13,704 | $719,890 | $107,160 | $612,730 |
| 2022 | $8,116 | $442,390 | $0 | $0 |
| 2021 | $7,903 | $429,510 | $0 | $0 |
| 2020 | $7,727 | $423,580 | $107,160 | $316,420 |
| 2019 | $8,844 | $482,010 | $0 | $0 |
| 2018 | $8,362 | $473,030 | $0 | $0 |
| 2017 | $8,222 | $462,220 | $0 | $0 |
| 2016 | $5,685 | $316,370 | $0 | $0 |
| 2015 | $5,405 | $314,180 | $0 | $0 |
| 2014 | $5,456 | $311,690 | $0 | $0 |
| 2013 | -- | $419,190 | $71,440 | $347,750 |
Source: Public Records
Map
Nearby Homes
- 3940 NE 30th Ave
- 3820 NE 29th Ave
- 3821 NE 29th Ave
- 3830 NE 28th Ave
- 4031 NE 27th Terrace
- 4050 NE 30th Ave
- 3800 NE 30th Ave
- 2921 NE 42nd St Unit 4B
- 3740 NE 29th Ave
- 3870 NE 31st Ave
- 2713 NE 42nd St Unit 2713
- 4121 NE 31st Ave
- 4060 NE 26th Ave
- 4220 NE 27th Ave
- 3700 NE 28th Ave
- 4011 NE 26th Ave
- 4220 NE 26th Terrace
- 1050 Hillsboro Mile Unit 406W
- 1050 Hillsboro Mile Unit 203W
- 1050 Hillsboro Mile Unit 805W
- 2811 NE 39th Ct
- 2831 NE 39th Ct
- 2820 NE 40th St
- 2810 NE 40th St
- 2830 NE 40th St
- 2830 NE 39th Ct
- 2801 NE 39th Ct
- 2901 NE 39th Ct
- 2900 NE 39th Ct
- 2800 NE 40th St
- 2900 NE 40th St
- 2810 NE 39th Ct
- 2810 2810 Ne 39th Ct
- 2910 NE 39th Ct
- 2831 NE 39th St
- 2821 NE 40th St
- 2821 NE 39th St
- 2741 NE 39th Ct
- 2730 NE 40th St