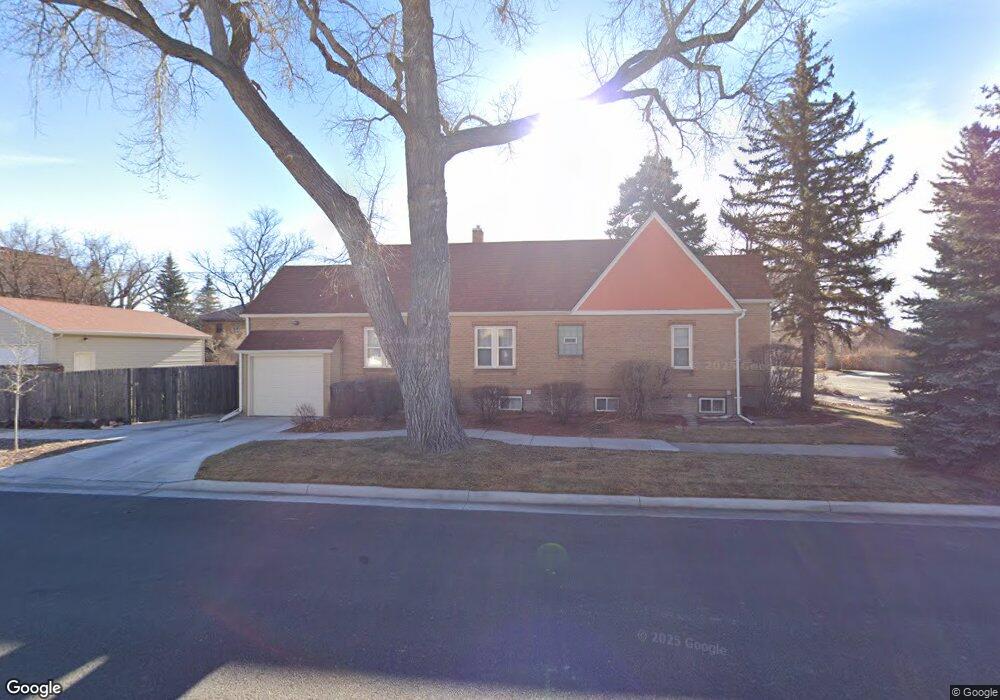
2821 Pioneer Ave Cheyenne, WY 82001
Historic Cheyenne NeighborhoodEstimated Value: $386,000 - $478,000
4
Beds
2
Baths
1,215
Sq Ft
$361/Sq Ft
Est. Value
About This Home
This home is located at 2821 Pioneer Ave, Cheyenne, WY 82001 and is currently estimated at $439,079, approximately $361 per square foot. 2821 Pioneer Ave is a home located in Laramie County with nearby schools including Pioneer Park Elementary School, McCormick Junior High School, and Central High School.
Ownership History
Date
Name
Owned For
Owner Type
Purchase Details
Closed on
Jun 30, 2015
Sold by
Burdette Thomas M and Burdette Jennifer R
Bought by
Schultz Donald I and Schultz Ursula P
Current Estimated Value
Purchase Details
Closed on
Jul 30, 2009
Sold by
Lydigsen Theodore L and Lydigsen Janet L
Bought by
Burdette Thomas M and Burdette Jennifer R
Home Financials for this Owner
Home Financials are based on the most recent Mortgage that was taken out on this home.
Original Mortgage
$231,725
Interest Rate
5.41%
Mortgage Type
FHA
Purchase Details
Closed on
Oct 1, 2004
Sold by
Sorensen Ilse
Bought by
Lydigsen Theodore L and Lydigsen Janet L
Home Financials for this Owner
Home Financials are based on the most recent Mortgage that was taken out on this home.
Original Mortgage
$128,800
Interest Rate
5.81%
Mortgage Type
Purchase Money Mortgage
Create a Home Valuation Report for This Property
The Home Valuation Report is an in-depth analysis detailing your home's value as well as a comparison with similar homes in the area
Home Values in the Area
Average Home Value in this Area
Purchase History
| Date | Buyer | Sale Price | Title Company |
|---|---|---|---|
| Schultz Donald I | -- | First American Title | |
| Burdette Thomas M | -- | None Available | |
| Lydigsen Theodore L | -- | Summit Title Services |
Source: Public Records
Mortgage History
| Date | Status | Borrower | Loan Amount |
|---|---|---|---|
| Previous Owner | Burdette Thomas M | $231,725 | |
| Previous Owner | Lydigsen Theodore L | $128,800 |
Source: Public Records
Tax History Compared to Growth
Tax History
| Year | Tax Paid | Tax Assessment Tax Assessment Total Assessment is a certain percentage of the fair market value that is determined by local assessors to be the total taxable value of land and additions on the property. | Land | Improvement |
|---|---|---|---|---|
| 2025 | $2,995 | $33,479 | $2,600 | $30,879 |
| 2024 | $2,995 | $42,349 | $3,466 | $38,883 |
| 2023 | $2,895 | $40,942 | $3,466 | $37,476 |
| 2022 | $2,513 | $34,812 | $3,466 | $31,346 |
| 2021 | $2,231 | $30,842 | $3,466 | $27,376 |
| 2020 | $1,980 | $27,449 | $3,466 | $23,983 |
| 2019 | $1,928 | $26,703 | $3,466 | $23,237 |
| 2018 | $1,745 | $24,396 | $2,866 | $21,530 |
| 2017 | $1,627 | $22,538 | $2,866 | $19,672 |
| 2016 | $1,539 | $21,314 | $2,633 | $18,681 |
| 2015 | $1,325 | $18,343 | $2,633 | $15,710 |
| 2014 | $1,365 | $18,775 | $2,633 | $16,142 |
Source: Public Records
Map
Nearby Homes
- 3021 Thomes Ave
- 2615 Capitol Ave
- 104 W Pershing Blvd
- 3315 Moore Ave
- 3018 Bent Ave
- 2812 Bent Ave
- 3112 Bent Ave
- 712 W 31st St
- 122 E 27th St
- 3068 Reed Ave
- 2916 Reed Ave
- 620 W 25th St
- 3202 Reed Ave
- 210 E 1st Ave
- 3512 Moore Ave
- 312 E Pershing Blvd
- 115 W 3rd Ave
- 3517 Central Ave
- 900 W 31st St
- 515 W 24th St
- 2817 Pioneer Ave
- 2813 Pioneer Ave
- 2822 Carey Ave
- 2901 Pioneer Ave
- 2814 Carey Ave
- 2907 Pioneer Ave
- 320 W 28th St
- 322 W 28th St
- 2900 Carey Ave
- 2820 Pioneer Ave
- 2814 Pioneer Ave
- 2911 Pioneer Ave
- 2900 Pioneer Ave
- 2800 Carey Ave
- 2908 Carey Ave
- 402 W 28th St
- 2915 Pioneer Ave
- 412 W 29th St
- 415 W 29th St
- 415 & 417 29th St