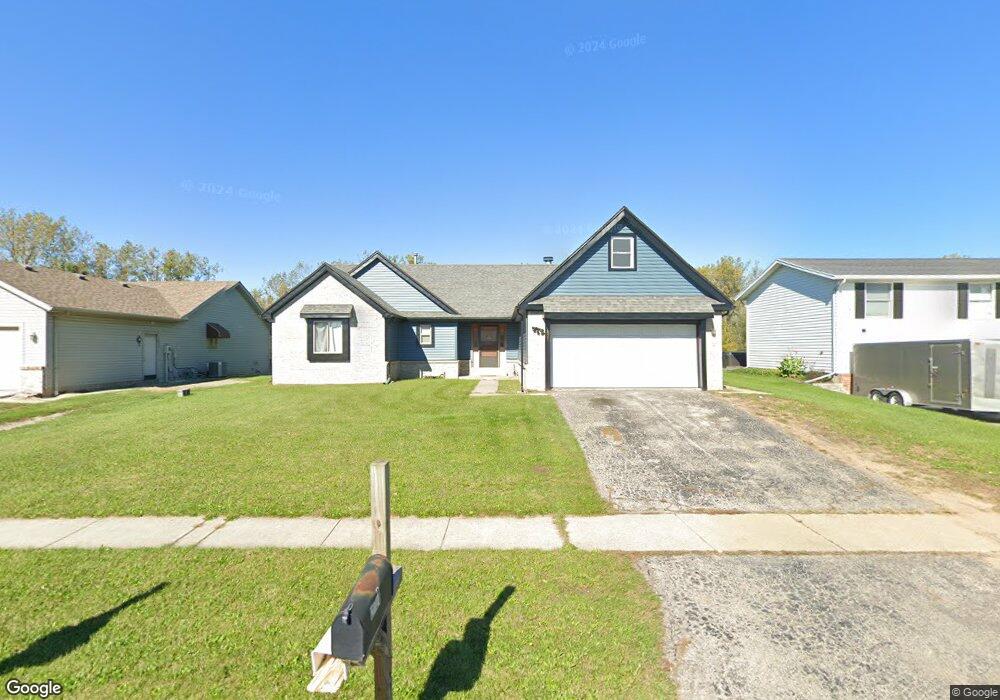
2821 Quincy St Oregon, OH 43616
Estimated Value: $246,700 - $275,000
3
Beds
2
Baths
1,653
Sq Ft
$158/Sq Ft
Est. Value
About This Home
This home is located at 2821 Quincy St, Oregon, OH 43616 and is currently estimated at $261,675, approximately $158 per square foot. 2821 Quincy St is a home located in Lucas County with nearby schools including Toledo Preparatory Academy, Kenmore Preparatory Academy dba Toledo Preparatory Academy, and First St. John Day School.
Ownership History
Date
Name
Owned For
Owner Type
Purchase Details
Closed on
Dec 12, 2012
Sold by
Nagypaul Christine M and Nagypaul Victoria
Bought by
Barber James T and Barber Shannon M
Current Estimated Value
Home Financials for this Owner
Home Financials are based on the most recent Mortgage that was taken out on this home.
Original Mortgage
$128,921
Outstanding Balance
$89,321
Interest Rate
3.37%
Mortgage Type
FHA
Estimated Equity
$172,354
Purchase Details
Closed on
May 10, 2002
Sold by
Boraby Mike K and Boraby Fatima A
Bought by
Nagypaul Christine M and Nagypaul Victoria L
Home Financials for this Owner
Home Financials are based on the most recent Mortgage that was taken out on this home.
Original Mortgage
$130,000
Interest Rate
7.24%
Purchase Details
Closed on
Nov 12, 1993
Sold by
Holt Michael R and Holt Jean L
Purchase Details
Closed on
Aug 15, 1991
Sold by
Moore Jeffrey A #
Purchase Details
Closed on
Mar 19, 1990
Sold by
Wagner Lewis E and Wagner Phyliss J
Create a Home Valuation Report for This Property
The Home Valuation Report is an in-depth analysis detailing your home's value as well as a comparison with similar homes in the area
Home Values in the Area
Average Home Value in this Area
Purchase History
| Date | Buyer | Sale Price | Title Company |
|---|---|---|---|
| Barber James T | $131,300 | Chicago Title Box | |
| Nagypaul Christine M | $162,500 | Louisville Title Agency For | |
| -- | $114,300 | -- | |
| -- | $116,000 | -- | |
| -- | $14,000 | -- |
Source: Public Records
Mortgage History
| Date | Status | Borrower | Loan Amount |
|---|---|---|---|
| Open | Barber James T | $128,921 | |
| Previous Owner | Nagypaul Christine M | $130,000 |
Source: Public Records
Tax History Compared to Growth
Tax History
| Year | Tax Paid | Tax Assessment Tax Assessment Total Assessment is a certain percentage of the fair market value that is determined by local assessors to be the total taxable value of land and additions on the property. | Land | Improvement |
|---|---|---|---|---|
| 2024 | $1,587 | $65,975 | $11,550 | $54,425 |
| 2023 | $3,305 | $58,695 | $9,940 | $48,755 |
| 2022 | $3,328 | $58,695 | $9,940 | $48,755 |
| 2021 | $3,354 | $58,695 | $9,940 | $48,755 |
| 2020 | $3,056 | $47,460 | $8,050 | $39,410 |
| 2019 | $2,971 | $47,460 | $8,050 | $39,410 |
| 2018 | $2,837 | $47,460 | $8,050 | $39,410 |
| 2017 | $2,766 | $41,335 | $7,315 | $34,020 |
| 2016 | $2,732 | $118,100 | $20,900 | $97,200 |
| 2015 | $2,715 | $118,100 | $20,900 | $97,200 |
| 2014 | $2,471 | $40,540 | $7,180 | $33,360 |
| 2013 | $2,471 | $40,540 | $7,180 | $33,360 |
Source: Public Records
Map
Nearby Homes
- 2849 Hartley St
- 2745 Mechanic St
- 2958 Springwood St S
- 223 Sequoia Dr
- 15 Van Buren Ave
- 632 Whitlock Ave
- 2329 Seaman St
- 2809 Starr Ave
- 2142 Woodford St
- 331 Crestway Dr
- 2435 Woodford St
- 266 Milford St
- 2601 Randall Dr
- 358 Crestway Dr
- 422 S Fargo St
- 2320 Valentine St
- 2137 Valentine St
- 358 Burger St
- 325 Whittemore St
- 2142 Consaul St
- 2813 Quincy St
- 2829 Quincy St
- 2805 Quincy St
- 2837 Quincy St
- 2822 Quincy St
- 2814 Quincy St
- 2830 Quincy St
- 2845 Quincy St
- 122 N Berlin Ave
- 2836 Quincy St
- 2842 Quincy St
- 2851 Quincy St
- 2823 Hartley St
- 2815 Hartley St
- 2829 Hartley St
- 125 Luella St
- 125 N Berlin Ave
- 108 N Berlin Ave
- 2835 Hartley St
- 2841 Hartley St