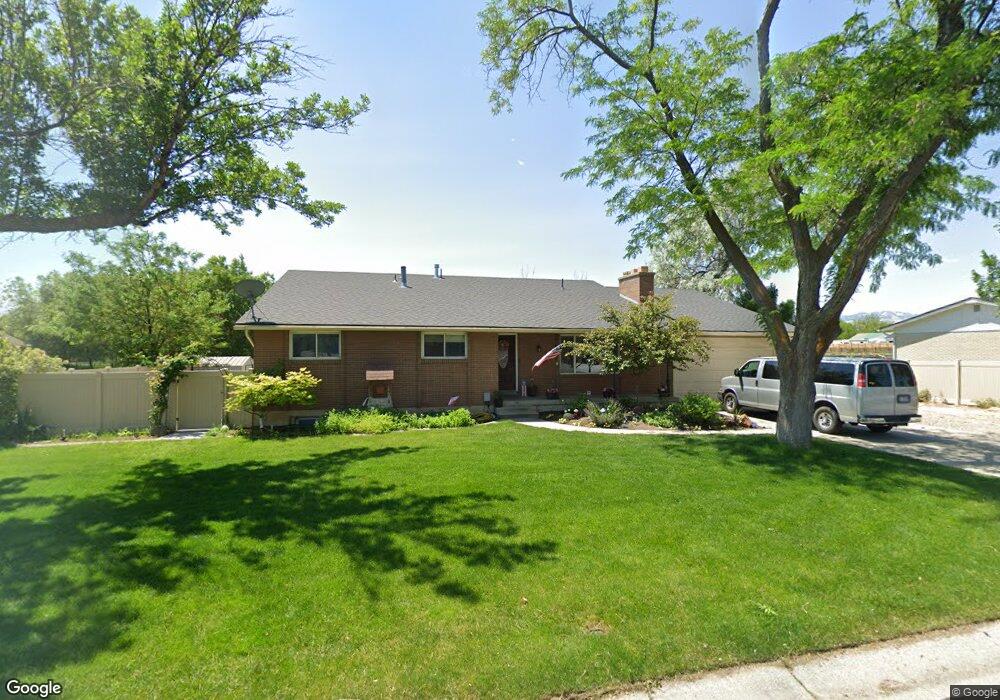
2821 W 7180 S West Jordan, UT 84084
Estimated Value: $586,000 - $752,049
4
Beds
2
Baths
2,738
Sq Ft
$246/Sq Ft
Est. Value
About This Home
This home is located at 2821 W 7180 S, West Jordan, UT 84084 and is currently estimated at $673,262, approximately $245 per square foot. 2821 W 7180 S is a home located in Salt Lake County with nearby schools including Westland Elementary School, West Jordan Middle School, and West Jordan High School.
Ownership History
Date
Name
Owned For
Owner Type
Purchase Details
Closed on
Mar 16, 2020
Sold by
Brien James O
Bought by
Brien James O and Brien Tansy O
Current Estimated Value
Home Financials for this Owner
Home Financials are based on the most recent Mortgage that was taken out on this home.
Original Mortgage
$346,350
Outstanding Balance
$273,192
Interest Rate
3.4%
Mortgage Type
New Conventional
Estimated Equity
$400,070
Purchase Details
Closed on
Oct 26, 2010
Sold by
Lott Brittany
Bought by
Obrien James
Home Financials for this Owner
Home Financials are based on the most recent Mortgage that was taken out on this home.
Original Mortgage
$140,800
Interest Rate
4.33%
Mortgage Type
New Conventional
Purchase Details
Closed on
Aug 11, 2004
Sold by
Burningham David Craig and Burningham David C
Bought by
Burningham David Craig
Home Financials for this Owner
Home Financials are based on the most recent Mortgage that was taken out on this home.
Original Mortgage
$165,000
Interest Rate
5.97%
Mortgage Type
New Conventional
Purchase Details
Closed on
Jan 30, 2004
Sold by
Griffin Rebecca Lee and Burningham Dixie L
Bought by
Burningham David C
Create a Home Valuation Report for This Property
The Home Valuation Report is an in-depth analysis detailing your home's value as well as a comparison with similar homes in the area
Home Values in the Area
Average Home Value in this Area
Purchase History
| Date | Buyer | Sale Price | Title Company |
|---|---|---|---|
| Brien James O | -- | Investors Title Ins Agcy | |
| Obrien James | -- | First American Title | |
| Burningham David Craig | -- | Merrill Title | |
| Burningham David C | -- | -- | |
| Burningham David C | -- | -- |
Source: Public Records
Mortgage History
| Date | Status | Borrower | Loan Amount |
|---|---|---|---|
| Open | Brien James O | $346,350 | |
| Closed | Obrien James | $140,800 | |
| Previous Owner | Burningham David Craig | $165,000 |
Source: Public Records
Tax History Compared to Growth
Tax History
| Year | Tax Paid | Tax Assessment Tax Assessment Total Assessment is a certain percentage of the fair market value that is determined by local assessors to be the total taxable value of land and additions on the property. | Land | Improvement |
|---|---|---|---|---|
| 2025 | $3,431 | $706,100 | $276,100 | $430,000 |
| 2024 | $3,431 | $660,100 | $265,400 | $394,700 |
| 2023 | $3,294 | $597,300 | $263,700 | $333,600 |
| 2022 | $3,379 | $602,700 | $258,500 | $344,200 |
| 2021 | $2,687 | $436,400 | $211,600 | $224,800 |
| 2020 | $2,717 | $414,100 | $211,600 | $202,500 |
| 2019 | $2,654 | $396,600 | $180,700 | $215,900 |
| 2018 | $1,805 | $267,600 | $150,600 | $117,000 |
| 2017 | $1,696 | $250,300 | $150,600 | $99,700 |
| 2016 | $1,661 | $230,300 | $150,600 | $79,700 |
| 2015 | $1,784 | $241,200 | $154,700 | $86,500 |
| 2014 | $1,624 | $216,100 | $140,200 | $75,900 |
Source: Public Records
Map
Nearby Homes
- 7361 S 2700 W
- 8524 S Michele River Ave W Unit 109
- 6918 S Harvest Cir
- 2573 Jordan Meadows Ln
- 2510 W Jordan Meadows Ln
- 2886 W 7550 S
- 6893 S 3200 W
- 2421 W 6900 S
- 2312 W Hidden Bend Cove Unit 107
- 7604 S Autumn Dr
- 2683 W Carson Ln
- 7647 S 2500 W
- 7721 Sunset Cir
- 3383 W 6880 S
- 7122 S Wood Green Rd
- 2386 W 7680 S
- 6924 S 2160 W
- 3165 W 7720 S
- 7611 S Springbrook Dr
- 6894 S 3420 W