B
Seller's Agent in 2025
Brian Schaper
Metro Real Estate, LLC
(260) 710-4074
5 in this area
132 Total Sales


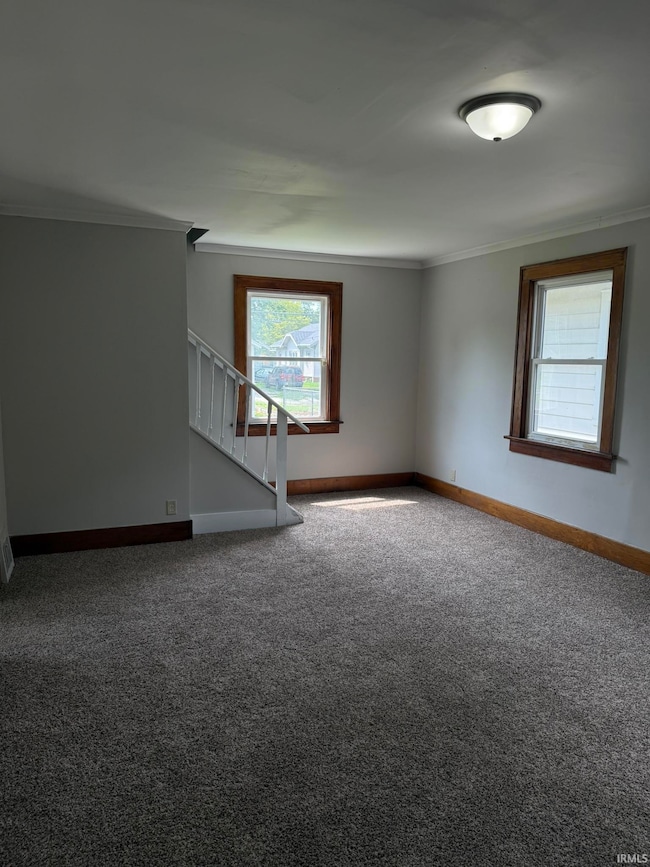
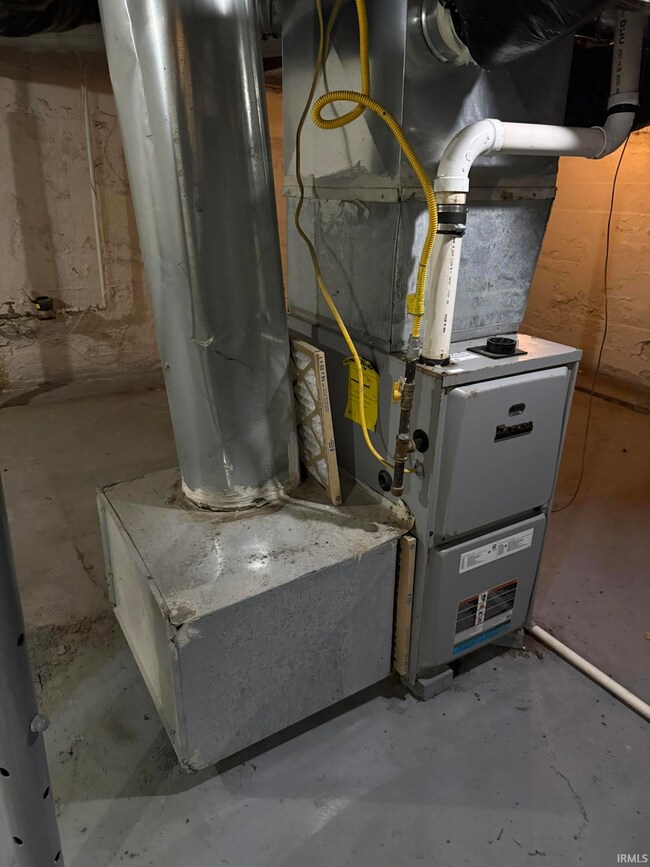

NEW CENTRAL AIR INCLUDED with this Beautiful 4 bedroom 2 bath on a nice corner lot with many nice features and updates. Large master bedroom with full bath on the main level with 3 bedrooms and a full bath up! Garage and enclosed front porch, large living room great for entertaining. NEWER replacement windows! All information believed accurate but not guaranteed and should be verified including schools. Listing agent does seller representation only
| Date | Type | Sale Price | Title Company |
|---|---|---|---|
| Warranty Deed | -- | Metropolitan Title Of In | |
| Public Action Common In Florida Clerks Tax Deed Or Tax Deeds Or Property Sold For Taxes | $1,772 | None Available | |
| Warranty Deed | -- | Progressive Land Title Of In | |
| Warranty Deed | -- | -- | |
| Quit Claim Deed | -- | -- |
| Date | Status | Loan Amount | Loan Type |
|---|---|---|---|
| Open | $96,000 | New Conventional | |
| Previous Owner | $30,500 | Purchase Money Mortgage | |
| Previous Owner | $35,000 | Unknown |
| Date | Event | Price | List to Sale | Price per Sq Ft |
|---|---|---|---|---|
| 10/03/2025 10/03/25 | Sold | $120,000 | -11.0% | $84 / Sq Ft |
| 09/11/2025 09/11/25 | Pending | -- | -- | -- |
| 09/03/2025 09/03/25 | Price Changed | $134,900 | -6.9% | $95 / Sq Ft |
| 08/07/2025 08/07/25 | For Sale | $144,900 | -- | $102 / Sq Ft |
| Year | Tax Paid | Tax Assessment Tax Assessment Total Assessment is a certain percentage of the fair market value that is determined by local assessors to be the total taxable value of land and additions on the property. | Land | Improvement |
|---|---|---|---|---|
| 2024 | $1,203 | $62,600 | $12,300 | $50,300 |
| 2022 | $982 | $43,700 | $4,900 | $38,800 |
| 2021 | $656 | $29,300 | $1,100 | $28,200 |
| 2020 | $573 | $26,200 | $1,000 | $25,200 |
| 2019 | $610 | $28,000 | $1,100 | $26,900 |
| 2018 | $568 | $39,000 | $1,500 | $37,500 |
| 2017 | $611 | $27,600 | $1,100 | $26,500 |
| 2016 | $534 | $24,500 | $1,100 | $23,400 |
| 2014 | $281 | $13,500 | $1,100 | $12,400 |
| 2013 | $218 | $11,700 | $1,100 | $10,600 |
B
Seller's Agent in 2025
Brian Schaper
Metro Real Estate, LLC
(260) 710-4074
5 in this area
132 Total Sales

Buyer's Agent in 2025
Tamia Armstrong
CENTURY 21 Bradley Realty, Inc
(260) 750-1646
1 in this area
69 Total Sales
Source: Indiana Regional MLS
MLS Number: 202531268
APN: 02-13-18-102-025.000-074
Disclaimer: Certain information contained herein is derived from information provided by parties other than Homes.com. All information provided is deemed reliable, but is not guaranteed to be accurate and should be independently verified.
![]() IDX information is provided exclusively for personal, non-commercial use, and may not be used for any purpose other than to identify prospective properties consumers may be interested in purchasing. Information is deemed reliable but not guaranteed.
IDX information is provided exclusively for personal, non-commercial use, and may not be used for any purpose other than to identify prospective properties consumers may be interested in purchasing. Information is deemed reliable but not guaranteed.