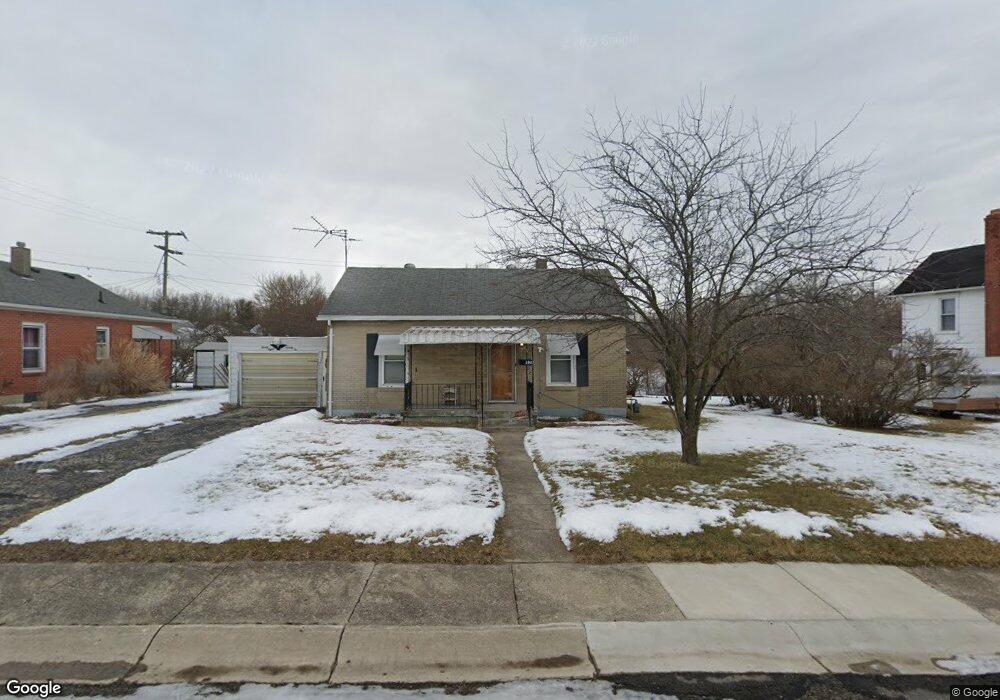
2822 Kohl Ave Springfield, OH 45503
Estimated Value: $128,000 - $155,000
2
Beds
1
Bath
1,068
Sq Ft
$130/Sq Ft
Est. Value
About This Home
This home is located at 2822 Kohl Ave, Springfield, OH 45503 and is currently estimated at $139,257, approximately $130 per square foot. 2822 Kohl Ave is a home located in Clark County with nearby schools including Warder Park-Wayne Elementary School, Schaefer Middle School, and Springfield High School.
Ownership History
Date
Name
Owned For
Owner Type
Purchase Details
Closed on
May 13, 2009
Sold by
Wells Fargo Bank Na
Bought by
Craig Robert V and Craig Connie P
Current Estimated Value
Purchase Details
Closed on
Mar 9, 2009
Sold by
Buskirk Marvin
Bought by
Wells Fargo Bank Na
Purchase Details
Closed on
May 18, 2005
Sold by
Derr Kevin and Derr Julie
Bought by
Buskirk Marvin
Home Financials for this Owner
Home Financials are based on the most recent Mortgage that was taken out on this home.
Original Mortgage
$76,500
Interest Rate
8.7%
Mortgage Type
Fannie Mae Freddie Mac
Purchase Details
Closed on
Mar 26, 2004
Sold by
Hud
Bought by
Derr Kevin
Home Financials for this Owner
Home Financials are based on the most recent Mortgage that was taken out on this home.
Original Mortgage
$50,000
Interest Rate
5.65%
Mortgage Type
Purchase Money Mortgage
Purchase Details
Closed on
Nov 7, 2003
Sold by
Dewine Michael B
Bought by
Hud
Create a Home Valuation Report for This Property
The Home Valuation Report is an in-depth analysis detailing your home's value as well as a comparison with similar homes in the area
Home Values in the Area
Average Home Value in this Area
Purchase History
| Date | Buyer | Sale Price | Title Company |
|---|---|---|---|
| Craig Robert V | $27,500 | Nova Title Agency Inc | |
| Wells Fargo Bank Na | $40,000 | None Available | |
| Buskirk Marvin | $74,000 | -- | |
| Derr Kevin | $37,100 | Lakeside Title & Escrow Agen | |
| Hud | $67,000 | -- |
Source: Public Records
Mortgage History
| Date | Status | Borrower | Loan Amount |
|---|---|---|---|
| Previous Owner | Buskirk Marvin | $76,500 | |
| Previous Owner | Derr Kevin | $50,000 |
Source: Public Records
Tax History
| Year | Tax Paid | Tax Assessment Tax Assessment Total Assessment is a certain percentage of the fair market value that is determined by local assessors to be the total taxable value of land and additions on the property. | Land | Improvement |
|---|---|---|---|---|
| 2025 | $1,375 | $35,050 | $5,680 | $29,370 |
| 2024 | $1,340 | $27,130 | $5,070 | $22,060 |
| 2023 | $1,340 | $27,130 | $5,070 | $22,060 |
| 2022 | $1,373 | $27,130 | $5,070 | $22,060 |
| 2021 | $1,193 | $21,710 | $4,060 | $17,650 |
| 2020 | $1,196 | $21,710 | $4,060 | $17,650 |
| 2019 | $1,199 | $21,710 | $4,060 | $17,650 |
| 2018 | $1,144 | $19,890 | $4,820 | $15,070 |
| 2017 | $1,143 | $19,887 | $4,816 | $15,071 |
| 2016 | $1,145 | $19,887 | $4,816 | $15,071 |
| 2015 | $1,167 | $19,887 | $4,816 | $15,071 |
| 2014 | $1,162 | $19,887 | $4,816 | $15,071 |
| 2013 | $1,150 | $19,887 | $4,816 | $15,071 |
Source: Public Records
Map
Nearby Homes
- 2730 E Main St
- 375 N Fostoria Ave
- 2702 Maplewood Ave
- 138 Lawnview Ave
- 129 N Burnett Rd
- 115 S Burnett Rd
- 3012 E High St
- 2425 Kenilworth Ave
- 2804 Lowman St
- 451 Lawnview Ave
- 360 Buxton Ave
- 2201 Woodside Ave
- 374 Raffensperger Ave
- 2845 Columbus Ave Unit 5
- 907 Bellevue Ave
- 2745 Share St
- 26 N Belmont Ave
- 250 S Douglas Ave Unit 254
- 218 Golden Gate Ave
- 2020 Woodside Ave
- 2816 Kohl Ave
- 2854 Kohl Ave
- 124 N Fostoria Ave
- 118 N Fostoria Ave
- 130 N Fostoria Ave
- 206 N Fostoria Ave
- 212 N Fostoria Ave
- 2840 E Main St
- 218 N Fostoria Ave
- 123 N Fostoria Ave
- 224 N Fostoria Ave
- 129 N Fostoria Ave
- 117 N Fostoria Ave
- 203 N Fostoria Ave
- 209 N Fostoria Ave
- 230 N Fostoria Ave
- 215 N Fostoria Ave
- 221 N Fostoria Ave
- 234 N Fostoria Ave
- 2817 E Main St
Your Personal Tour Guide
Ask me questions while you tour the home.