Estimated Value: $393,812 - $429,000
3
Beds
2
Baths
1,772
Sq Ft
$233/Sq Ft
Est. Value
About This Home
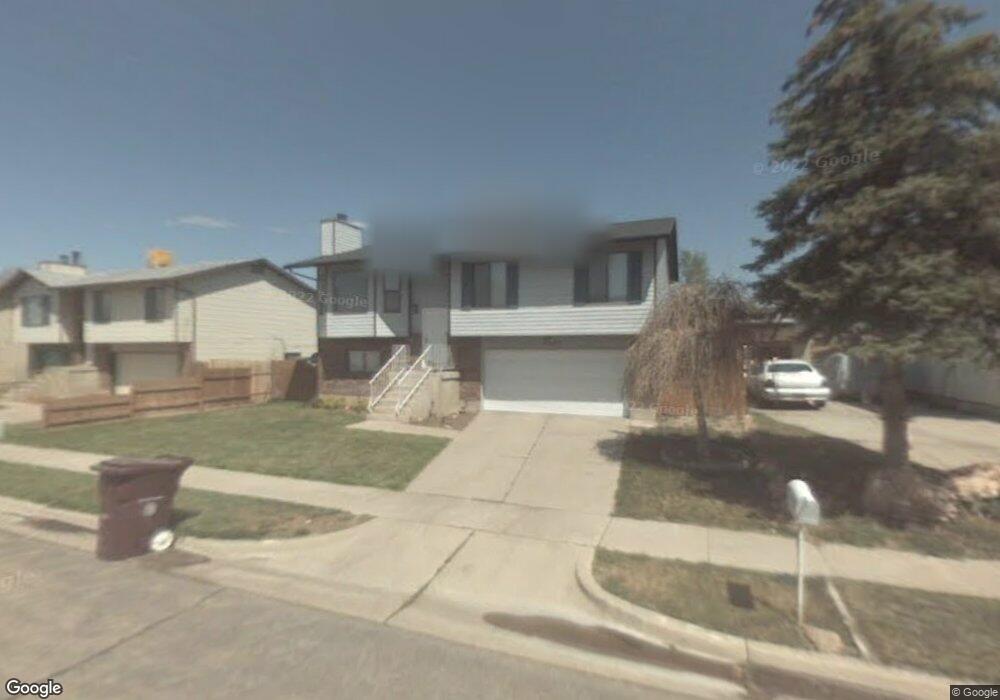
This home is located at 2822 W 5825 S, Roy, UT 84067 and is currently estimated at $412,953, approximately $233 per square foot. 2822 W 5825 S is a home located in Weber County with nearby schools including Roy Elementary School, Roy Junior High School, and Roy High School.
Ownership History
Date
Name
Owned For
Owner Type
Purchase Details
Closed on
Mar 18, 2021
Sold by
Market Lisa and Marker Corey R
Bought by
Marker Lisa and Marker Corey R
Current Estimated Value
Home Financials for this Owner
Home Financials are based on the most recent Mortgage that was taken out on this home.
Original Mortgage
$120,000
Outstanding Balance
$88,946
Interest Rate
2.7%
Mortgage Type
New Conventional
Estimated Equity
$324,007
Purchase Details
Closed on
Oct 14, 2005
Sold by
Marker Lisa
Bought by
Marker Corey R
Home Financials for this Owner
Home Financials are based on the most recent Mortgage that was taken out on this home.
Original Mortgage
$105,920
Interest Rate
6.12%
Mortgage Type
Fannie Mae Freddie Mac
Purchase Details
Closed on
Jul 29, 2004
Sold by
Hobson Scott S
Bought by
Hobson Scott S
Purchase Details
Closed on
Apr 28, 1998
Sold by
Hobson Stephen G and Hobson Andrea A
Bought by
Hobson Scott S
Home Financials for this Owner
Home Financials are based on the most recent Mortgage that was taken out on this home.
Original Mortgage
$73,500
Interest Rate
7.06%
Mortgage Type
Purchase Money Mortgage
Create a Home Valuation Report for This Property
The Home Valuation Report is an in-depth analysis detailing your home's value as well as a comparison with similar homes in the area
Home Values in the Area
Average Home Value in this Area
Purchase History
| Date | Buyer | Sale Price | Title Company |
|---|---|---|---|
| Marker Lisa | -- | Us Title Ins Agency | |
| Marker Corey R | -- | First American Title | |
| Marker Lisa | -- | First American Title | |
| Hobson Scott S | -- | -- | |
| Hobson Scott S | -- | Associated Title |
Source: Public Records
Mortgage History
| Date | Status | Borrower | Loan Amount |
|---|---|---|---|
| Open | Marker Lisa | $120,000 | |
| Closed | Marker Lisa | $105,920 | |
| Previous Owner | Hobson Scott S | $73,500 |
Source: Public Records
Tax History Compared to Growth
Tax History
| Year | Tax Paid | Tax Assessment Tax Assessment Total Assessment is a certain percentage of the fair market value that is determined by local assessors to be the total taxable value of land and additions on the property. | Land | Improvement |
|---|---|---|---|---|
| 2025 | $2,457 | $386,734 | $109,710 | $277,024 |
| 2024 | $2,397 | $208,999 | $60,353 | $148,646 |
| 2023 | $2,408 | $211,200 | $63,218 | $147,982 |
| 2022 | $2,263 | $202,950 | $51,548 | $151,402 |
| 2021 | $1,955 | $289,000 | $60,476 | $228,524 |
| 2020 | $1,775 | $240,000 | $60,476 | $179,524 |
| 2019 | $1,743 | $222,000 | $36,403 | $185,597 |
| 2018 | $1,633 | $195,000 | $33,543 | $161,457 |
| 2017 | $1,594 | $178,792 | $32,816 | $145,976 |
| 2016 | $1,478 | $88,574 | $18,352 | $70,222 |
| 2015 | $1,281 | $77,534 | $18,352 | $59,182 |
| 2014 | $1,292 | $77,534 | $18,352 | $59,182 |
Source: Public Records
Map
Nearby Homes