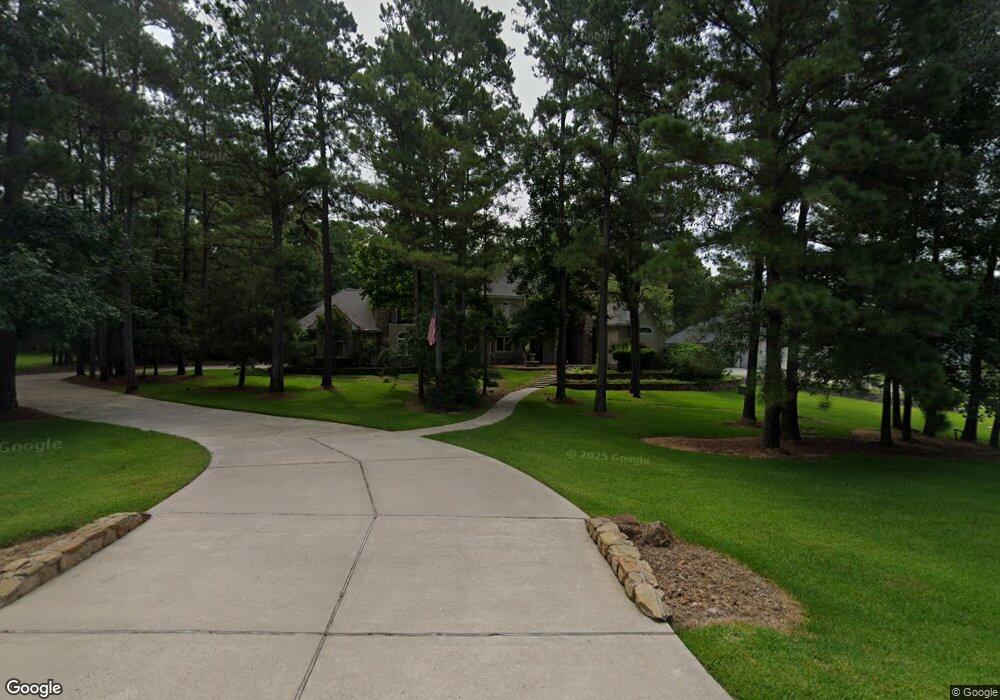
28228 Emerald Oaks Magnolia, TX 77355
Estimated Value: $1,365,000 - $1,884,000
--
Bed
1
Bath
6,145
Sq Ft
$261/Sq Ft
Est. Value
About This Home
This home is located at 28228 Emerald Oaks, Magnolia, TX 77355 and is currently estimated at $1,605,374, approximately $261 per square foot. 28228 Emerald Oaks is a home located in Montgomery County with nearby schools including Magnolia Elementary School, Magnolia Sixth Grade Campus, and Magnolia Junior High School.
Ownership History
Date
Name
Owned For
Owner Type
Purchase Details
Closed on
Jan 7, 2022
Sold by
Ovaitt Thomas L and Ovaitt Elizabeth Cheryl
Bought by
Parks Roger W and Parks Cynthia G
Current Estimated Value
Purchase Details
Closed on
Nov 10, 2014
Sold by
Hahigan James B and Hanigan Michelle R
Bought by
Ovaitt Thomas L and Ovaitt Sara M
Home Financials for this Owner
Home Financials are based on the most recent Mortgage that was taken out on this home.
Original Mortgage
$704,000
Interest Rate
4.21%
Mortgage Type
New Conventional
Purchase Details
Closed on
May 30, 2001
Sold by
Jack Frey Properties Inc
Bought by
Ovaitt Thomas L and Ovaitt Sara M
Home Financials for this Owner
Home Financials are based on the most recent Mortgage that was taken out on this home.
Original Mortgage
$81,101
Interest Rate
7.07%
Mortgage Type
Purchase Money Mortgage
Create a Home Valuation Report for This Property
The Home Valuation Report is an in-depth analysis detailing your home's value as well as a comparison with similar homes in the area
Home Values in the Area
Average Home Value in this Area
Purchase History
| Date | Buyer | Sale Price | Title Company |
|---|---|---|---|
| Parks Roger W | -- | None Listed On Document | |
| Ovaitt Thomas L | -- | Stewart Title | |
| Ovaitt Thomas L | -- | -- | |
| Hanigan James B | -- | Alamo Title Company |
Source: Public Records
Mortgage History
| Date | Status | Borrower | Loan Amount |
|---|---|---|---|
| Previous Owner | Ovaitt Thomas L | $704,000 | |
| Previous Owner | Hanigan James B | $81,101 |
Source: Public Records
Tax History Compared to Growth
Tax History
| Year | Tax Paid | Tax Assessment Tax Assessment Total Assessment is a certain percentage of the fair market value that is determined by local assessors to be the total taxable value of land and additions on the property. | Land | Improvement |
|---|---|---|---|---|
| 2025 | $19,390 | $1,681,997 | -- | -- |
| 2024 | $19,390 | $1,529,088 | -- | -- |
| 2023 | $19,277 | $1,390,080 | $219,290 | $1,170,790 |
| 2022 | $22,191 | $1,257,540 | $148,430 | $1,283,550 |
| 2021 | $21,249 | $1,143,220 | $272,810 | $870,410 |
| 2020 | $26,333 | $1,301,220 | $272,810 | $1,038,680 |
| 2019 | $23,823 | $1,182,930 | $272,810 | $910,120 |
| 2018 | $20,812 | $1,076,180 | $166,060 | $910,120 |
| 2017 | $22,353 | $1,054,150 | $166,060 | $910,120 |
| 2016 | $20,321 | $958,320 | $166,060 | $965,220 |
| 2015 | $19,257 | $871,200 | $166,060 | $705,140 |
| 2014 | $19,257 | $908,000 | $166,060 | $741,940 |
Source: Public Records
Map
Nearby Homes
- 28322 Meadow Forest
- 18742 Mink Lake Dr
- 37432 Clubhouse Ln
- Resolution 3K Plan at Waterford Run - Clayton
- Colossal Plan at Waterford Run - Clayton
- The Jackson Plan at Waterford Run - Jessup
- Crazy Eights Plan at Waterford Run - Clayton
- 28242 Forest Green Dr
- 18631 Mink Lake Dr
- TBD Fm 1774 Rd
- 24569 Fm 1488
- 28733 Lakeside Green
- 28208 Nichols Sawmill Rd
- 28103 Hitching Rack Ln
- 28002 Hitching Rack Ln
- 28523 Beth Marie
- 28543 Beth Marie
- 28046 Crossway Oaks
- 28028 Crossway Oaks
- 29010 Legacy Ct
- 28232 Emerald Oaks
- Lot 10 Emerald Oaks
- 28242 Emerald Oaks
- 28233 Emerald Oaks
- 28212 Emerald Oaks
- 28223 Emerald Oaks
- 28202 Emerald Oaks
- 28312 Emerald Oaks
- 37603 Meadowwood Green
- 28262 Eagle Cove
- 28152 Emerald Oaks
- 28275 Emerald Oaks
- 37612 Parkway Oaks
- 37602 Meadow Wood
- 28322 Emerald Oaks
- 5 & 6 Emerald Oaks
- 37802 Emerald Oaks
- 0 Emerald Oaks
- 28133 Meadow Falls
- 28242 Eagle Cove