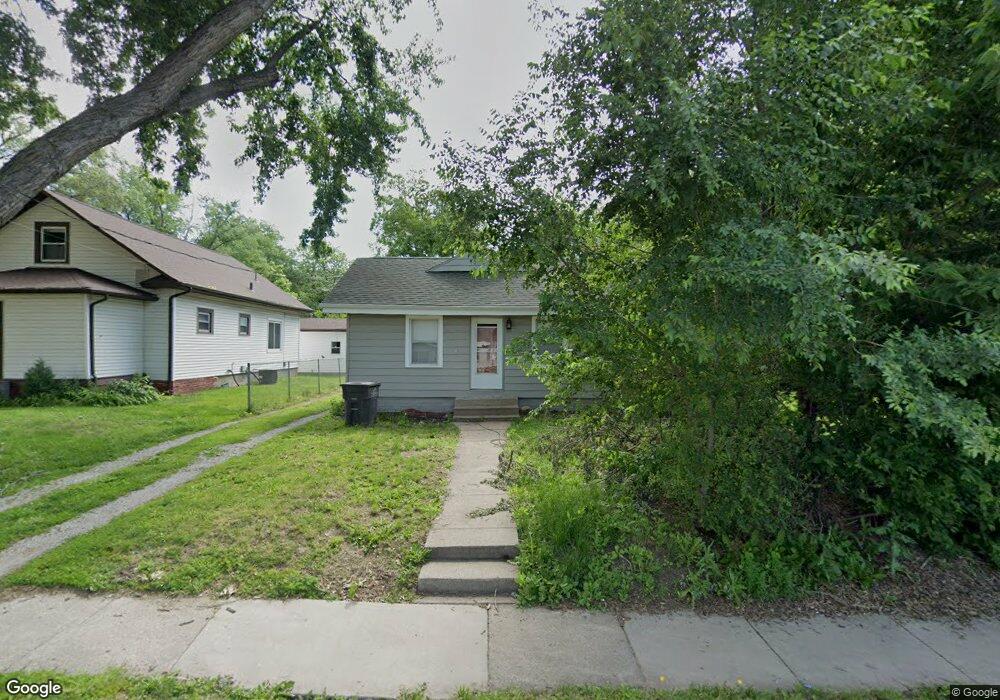
2823 2nd Ave Des Moines, IA 50313
Union Park NeighborhoodEstimated Value: $112,000 - $130,398
2
Beds
1
Bath
832
Sq Ft
$149/Sq Ft
Est. Value
About This Home
This home is located at 2823 2nd Ave, Des Moines, IA 50313 and is currently estimated at $123,850, approximately $148 per square foot. 2823 2nd Ave is a home located in Polk County with nearby schools including Findley Elementary School, Harding Middle School, and North High School.
Ownership History
Date
Name
Owned For
Owner Type
Purchase Details
Closed on
Jul 7, 2020
Sold by
Usa Homeownership Foundation Inc
Bought by
Sherrill Jennifer
Current Estimated Value
Purchase Details
Closed on
Mar 1, 2019
Sold by
Bank Of America Na
Bought by
Usa Homeownership Foundation In C
Purchase Details
Closed on
Aug 9, 2018
Sold by
Welter John James
Bought by
Bank Of America Na
Create a Home Valuation Report for This Property
The Home Valuation Report is an in-depth analysis detailing your home's value as well as a comparison with similar homes in the area
Home Values in the Area
Average Home Value in this Area
Purchase History
| Date | Buyer | Sale Price | Title Company |
|---|---|---|---|
| Sherrill Jennifer | -- | None Available | |
| Usa Homeownership Foundation In C | -- | Title365 | |
| Bank Of America Na | -- | Servicelink |
Source: Public Records
Tax History
| Year | Tax Paid | Tax Assessment Tax Assessment Total Assessment is a certain percentage of the fair market value that is determined by local assessors to be the total taxable value of land and additions on the property. | Land | Improvement |
|---|---|---|---|---|
| 2025 | $1,692 | $100,200 | $19,100 | $81,100 |
| 2024 | $1,692 | $86,000 | $16,400 | $69,600 |
| 2023 | $1,706 | $86,000 | $16,400 | $69,600 |
| 2022 | $1,694 | $72,400 | $14,300 | $58,100 |
| 2021 | $1,572 | $72,400 | $14,300 | $58,100 |
| 2020 | $1,634 | $63,000 | $12,500 | $50,500 |
| 2019 | $1,418 | $63,000 | $12,500 | $50,500 |
| 2018 | $1,248 | $55,600 | $10,800 | $44,800 |
| 2017 | $1,252 | $55,600 | $10,800 | $44,800 |
| 2016 | $1,214 | $54,800 | $10,600 | $44,200 |
| 2015 | $1,214 | $54,800 | $10,600 | $44,200 |
| 2014 | $1,344 | $61,400 | $11,700 | $49,700 |
Source: Public Records
Map
Nearby Homes
Your Personal Tour Guide
Ask me questions while you tour the home.