Estimated Value: $203,000 - $245,000
--
Bed
2
Baths
1,427
Sq Ft
$156/Sq Ft
Est. Value
About This Home
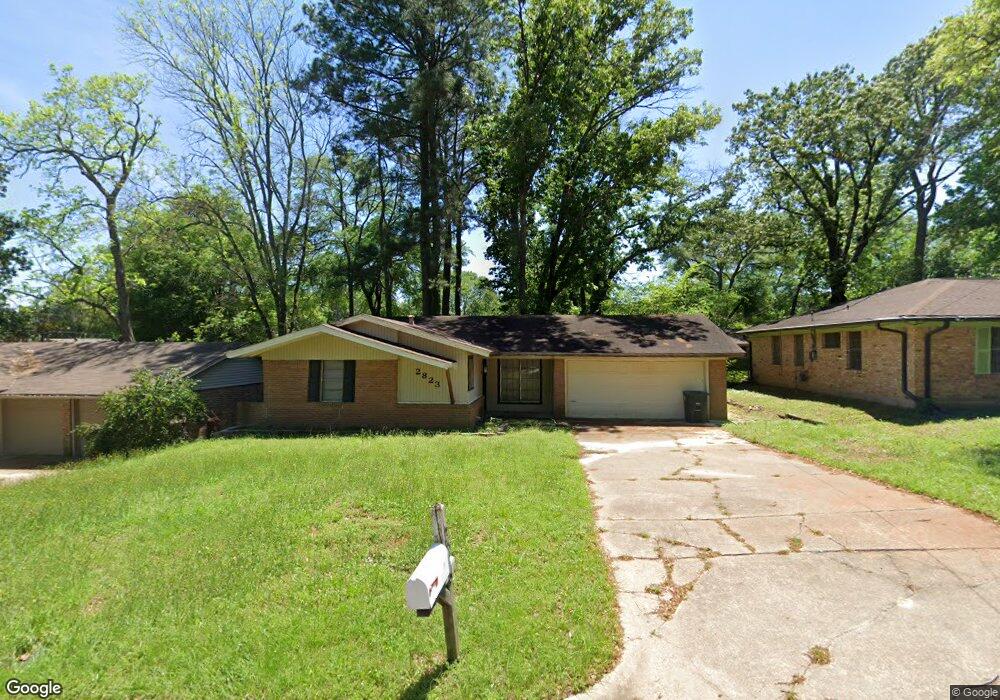
This home is located at 2823 Amy Ln, Tyler, TX 75701 and is currently estimated at $222,958, approximately $156 per square foot. 2823 Amy Ln is a home located in Smith County with nearby schools including Clarkston Elementary School, Hubbard Middle School, and Tyler Legacy High School.
Ownership History
Date
Name
Owned For
Owner Type
Purchase Details
Closed on
Oct 13, 2023
Sold by
Wells Acquisitions Llc
Bought by
Wells Michelle C and Wells John Paul
Current Estimated Value
Purchase Details
Closed on
Oct 17, 2022
Sold by
Bolen Brian M and Bolen Nina E
Bought by
Wells Acquisitions Llc
Home Financials for this Owner
Home Financials are based on the most recent Mortgage that was taken out on this home.
Original Mortgage
$130,300
Interest Rate
5.66%
Mortgage Type
Construction
Purchase Details
Closed on
Nov 14, 2006
Sold by
Burton Polly A and Burton Gary D
Bought by
Bolen Brian M and Bolen Nina E
Home Financials for this Owner
Home Financials are based on the most recent Mortgage that was taken out on this home.
Original Mortgage
$96,425
Interest Rate
9.95%
Mortgage Type
Purchase Money Mortgage
Create a Home Valuation Report for This Property
The Home Valuation Report is an in-depth analysis detailing your home's value as well as a comparison with similar homes in the area
Home Values in the Area
Average Home Value in this Area
Purchase History
| Date | Buyer | Sale Price | Title Company |
|---|---|---|---|
| Wells Michelle C | -- | None Listed On Document | |
| Wells Acquisitions Llc | -- | -- | |
| Bolen Brian M | -- | Fa |
Source: Public Records
Mortgage History
| Date | Status | Borrower | Loan Amount |
|---|---|---|---|
| Previous Owner | Wells Acquisitions Llc | $130,300 | |
| Previous Owner | Bolen Brian M | $96,425 |
Source: Public Records
Tax History Compared to Growth
Tax History
| Year | Tax Paid | Tax Assessment Tax Assessment Total Assessment is a certain percentage of the fair market value that is determined by local assessors to be the total taxable value of land and additions on the property. | Land | Improvement |
|---|---|---|---|---|
| 2025 | $3,251 | $185,540 | $26,884 | $158,656 |
| 2024 | $3,251 | $191,123 | $18,486 | $172,637 |
| 2023 | $2,509 | $143,945 | $18,486 | $125,459 |
| 2022 | $2,791 | $148,553 | $18,486 | $130,067 |
| 2021 | $2,717 | $129,507 | $18,486 | $111,021 |
| 2020 | $2,752 | $128,611 | $18,486 | $110,125 |
| 2019 | $2,630 | $121,679 | $16,432 | $105,247 |
| 2018 | $2,378 | $109,335 | $14,070 | $95,265 |
| 2017 | $2,334 | $109,335 | $14,070 | $95,265 |
| 2016 | $2,280 | $106,788 | $14,070 | $92,718 |
| 2015 | $1,957 | $106,081 | $14,070 | $92,011 |
| 2014 | $1,957 | $102,862 | $14,070 | $88,792 |
Source: Public Records
Map
Nearby Homes
- 2631 Amy Ln
- 2827 Fairfax Dr
- 3801 Old Troup Hwy
- 2417 Riviera Dr
- 2512 Alta Mira Dr
- 2902 Shenandoah Dr
- 2958 Calloway Rd
- 2830 Juniper Ln
- 2716 Roanoke Ln
- 3107 Lake Vista Cir
- 2509 Delmar Dr
- 3109 Campus Cir
- 2226 Mimosa Dr
- 3108 Williamsburg Cir
- 2523 Shenandoah Dr
- 3621 Rock Creek Dr
- 4004 Lazy Creek Dr
- 1920 McDonald Rd
- 3308 Moss Glen
- 2716 Royal Village Way