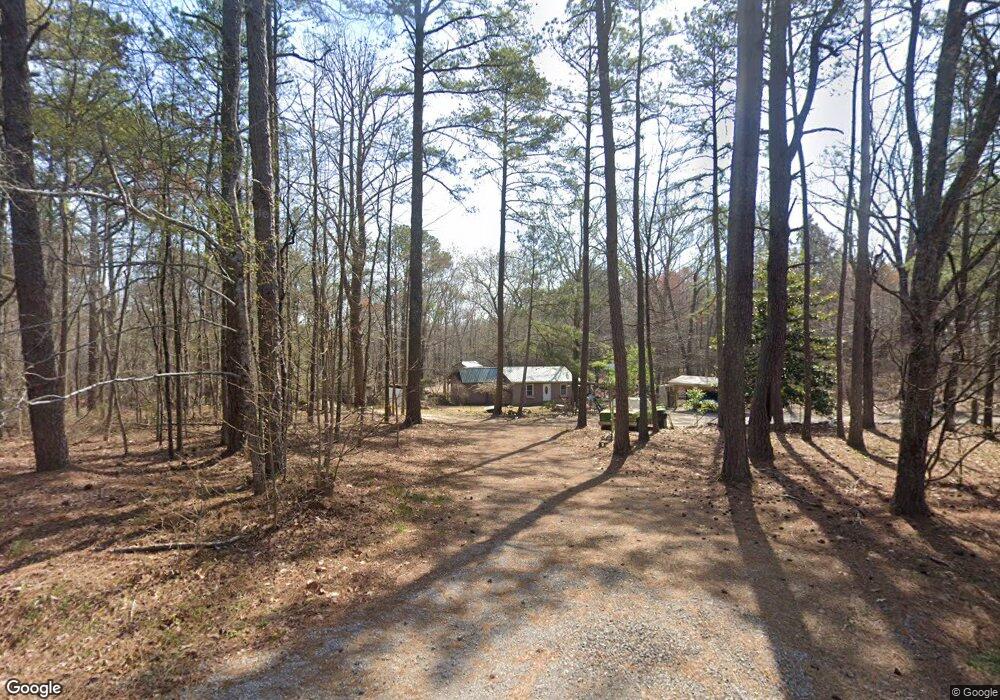
2823 Browning Rd Rockmart, GA 30153
Estimated Value: $204,224 - $374,000
4
Beds
1
Bath
1,192
Sq Ft
$246/Sq Ft
Est. Value
About This Home
This home is located at 2823 Browning Rd, Rockmart, GA 30153 and is currently estimated at $292,806, approximately $245 per square foot. 2823 Browning Rd is a home located in Polk County with nearby schools including Rockmart Middle School.
Ownership History
Date
Name
Owned For
Owner Type
Purchase Details
Closed on
Mar 4, 2005
Sold by
Bourg Roy
Bought by
Bourg Roy
Current Estimated Value
Purchase Details
Closed on
Dec 4, 2004
Sold by
Lbss Company
Bought by
Bourg Roy and Bourg Sharon
Purchase Details
Closed on
May 1, 1987
Sold by
Rice Gerald S and Rice
Bought by
Byars Lloyd L and Byars
Purchase Details
Closed on
Apr 27, 1987
Sold by
Carter Frank and Carter
Bought by
Rice Gerald S and Rice
Purchase Details
Closed on
Oct 29, 1986
Sold by
Frank Carter Co Inc
Bought by
Carter Frank and Carter
Purchase Details
Closed on
May 12, 1986
Bought by
Carter Frank and Carter
Purchase Details
Closed on
Aug 6, 1974
Sold by
Frank Carter Co Etal
Bought by
Frank Carter Co Inc
Purchase Details
Closed on
Aug 1, 1973
Sold by
Orr Inc
Bought by
Frank Carter Co Etal
Purchase Details
Closed on
Jan 1, 1973
Sold by
Atco Investment Co
Bought by
Orr Inc
Purchase Details
Closed on
Mar 5, 1971
Bought by
Atco Investment Co
Create a Home Valuation Report for This Property
The Home Valuation Report is an in-depth analysis detailing your home's value as well as a comparison with similar homes in the area
Home Values in the Area
Average Home Value in this Area
Purchase History
| Date | Buyer | Sale Price | Title Company |
|---|---|---|---|
| Bourg Roy | -- | -- | |
| Bourg Roy | -- | -- | |
| Bourg Roy | -- | -- | |
| Byars Lloyd L | $32,900 | -- | |
| Rice Gerald S | $568,700 | -- | |
| Carter Frank | -- | -- | |
| Carter Frank | -- | -- | |
| Carter Frank | -- | -- | |
| Frank Carter Co Inc | -- | -- | |
| Frank Carter Co Etal | -- | -- | |
| Orr Inc | -- | -- | |
| Atco Investment Co | -- | -- |
Source: Public Records
Tax History Compared to Growth
Tax History
| Year | Tax Paid | Tax Assessment Tax Assessment Total Assessment is a certain percentage of the fair market value that is determined by local assessors to be the total taxable value of land and additions on the property. | Land | Improvement |
|---|---|---|---|---|
| 2024 | $847 | $55,249 | $12,070 | $43,179 |
| 2023 | $616 | $39,337 | $12,070 | $27,267 |
| 2022 | $659 | $29,778 | $8,047 | $21,731 |
| 2021 | $668 | $29,778 | $8,047 | $21,731 |
| 2020 | $669 | $29,778 | $8,047 | $21,731 |
| 2019 | $705 | $28,249 | $6,687 | $21,562 |
| 2018 | $706 | $27,610 | $6,687 | $20,923 |
| 2017 | $697 | $27,610 | $6,687 | $20,923 |
| 2016 | $759 | $29,875 | $8,952 | $20,923 |
| 2015 | $761 | $29,875 | $8,952 | $20,923 |
| 2014 | $766 | $29,875 | $8,952 | $20,923 |
Source: Public Records
Map
Nearby Homes
- 2750 Browning Rd
- 249 Eastwood Path
- 1806 Browning Rd
- 3200 Rockmart Rd
- 1912 Hightower Rd
- 0 Hightower Rd Unit 10584768
- 0 Hightower Rd Unit 7633002
- 0 Hightower Rd Unit 10584778
- 0 Hightower Rd Unit 7632982
- None Maner Rd
- 0 Everett Mtn Rd
- 1252 Paris Mountain Rd
- 0 Hutcheson Road Off
- 33 Tolbert Rd
- 748 Maner Rd
- 2564 Vinson Mountain Rd
- 0 Tolbert Town Rd Unit 10640593
- 0 Tolbert Town Rd Unit 7678739
- 399 Ruff Rd
- 0 Browning Rd Unit 10621762
- 2701 Browning Rd
- 2710 Browning Rd
- 2650 Browning Rd
- 2627 Browning Rd
- 10 James Daniel Rd
- 108 James Daniel Rd
- 2620 Browning Rd
- 300 James Daniel Rd
- 2604 Browning Rd
- 2525 Browning Rd
- 157 James Daniel Rd
- 2507 Browning Rd
- 2696 Browning Rd
- 2506 Browning Rd
- 2495 Browning Rd
- 3051 Browning Rd
- X James Daniel Rd
- 225 James Daniel Rd
- 137 James Daniel Rd
- 3096 Browning Rd