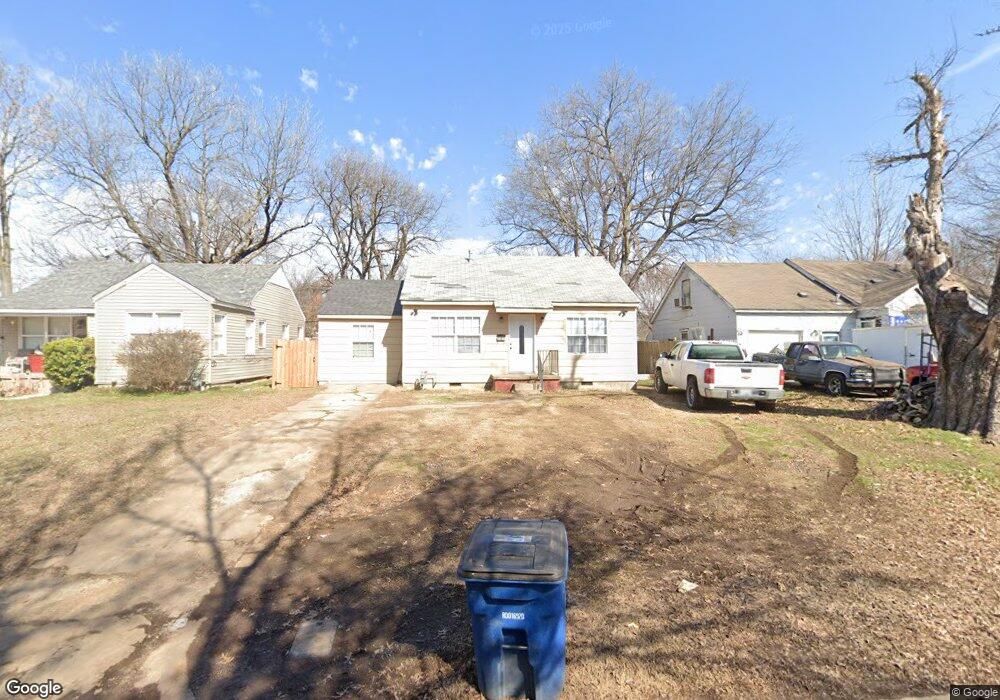
2823 E Admiral Ct Tulsa, OK 74110
Kendall-Whittier NeighborhoodEstimated Value: $97,945 - $138,000
2
Beds
1
Bath
812
Sq Ft
$150/Sq Ft
Est. Value
About This Home
This home is located at 2823 E Admiral Ct, Tulsa, OK 74110 and is currently estimated at $121,486, approximately $149 per square foot. 2823 E Admiral Ct is a home located in Tulsa County with nearby schools including Sequoyah Elementary School, Monroe Demonstration Academy, and McLain High School of Science and Technology.
Ownership History
Date
Name
Owned For
Owner Type
Purchase Details
Closed on
Dec 13, 2022
Sold by
Prime Opportunities Llc
Bought by
Santizo Eli and Barrios Clausi Marisol
Current Estimated Value
Purchase Details
Closed on
Dec 5, 2018
Sold by
Shadrick Richard and Shadrick Marissa
Bought by
Prime Opportunities Llc
Purchase Details
Closed on
Feb 9, 2018
Sold by
Shadricka Colen
Bought by
Shadricka Richard
Purchase Details
Closed on
Jul 8, 2014
Sold by
Shadrick Jean
Bought by
Shadrick Colen
Create a Home Valuation Report for This Property
The Home Valuation Report is an in-depth analysis detailing your home's value as well as a comparison with similar homes in the area
Home Values in the Area
Average Home Value in this Area
Purchase History
| Date | Buyer | Sale Price | Title Company |
|---|---|---|---|
| Santizo Eli | $15,000 | -- | |
| Prime Opportunities Llc | -- | None Available | |
| Shadricka Richard | -- | None Available | |
| Shadrick Colen | -- | None Available |
Source: Public Records
Tax History
| Year | Tax Paid | Tax Assessment Tax Assessment Total Assessment is a certain percentage of the fair market value that is determined by local assessors to be the total taxable value of land and additions on the property. | Land | Improvement |
|---|---|---|---|---|
| 2025 | $683 | $5,100 | $788 | $4,312 |
| 2024 | $587 | $4,857 | $825 | $4,032 |
| 2023 | $587 | $4,625 | $902 | $3,723 |
| 2022 | $514 | $3,855 | $902 | $2,953 |
| 2021 | $509 | $3,855 | $902 | $2,953 |
| 2020 | $502 | $3,855 | $902 | $2,953 |
| 2019 | $521 | $3,800 | $889 | $2,911 |
| 2018 | $497 | $3,619 | $847 | $2,772 |
| 2017 | $496 | $3,619 | $847 | $2,772 |
| 2016 | $486 | $3,619 | $847 | $2,772 |
| 2015 | $487 | $3,619 | $847 | $2,772 |
| 2014 | $216 | $3,619 | $847 | $2,772 |
Source: Public Records
Map
Nearby Homes
- 2836 E Admiral Blvd
- 119 N Columbia Ave
- 3015 E Archer St
- 2735 E 1st St
- 141 N College Ave
- 3118 E Archer St
- 724 N Evanston Ave
- 504 N Florence Place
- 812 N Delaware Place
- 2811 E 3rd St
- 2807 E 3rd St
- 3212 E Haskell St
- 2524 E Admiral Ct
- 211 S Florence Ave
- 232 S Florence Ave
- 2604 E 2nd St
- 3310 E Admiral Ct
- 2504 E 1st St
- 1043 N College Ave
- 2516 E 3rd St
- 2827 E Admiral Ct
- 2831 E Admiral Ct
- 2815 E Admiral Ct
- 2824 E Archer St
- 2820 E Archer St
- 2828 E Archer St
- 2809 E Admiral Ct
- 2824 E Admiral Ct
- 2814 E Archer St
- 2818 E Admiral Ct
- 2810 E Archer St
- 2838 E Archer St
- 2812 E Admiral Ct Unit 2812-2814
- 2841 E Admiral Ct
- 2803 E Admiral Ct
- 2808 E Admiral Ct
- 2823 E Admiral Place
- 2806 E Archer St
- 2840 E Archer St
Your Personal Tour Guide
Ask me questions while you tour the home.