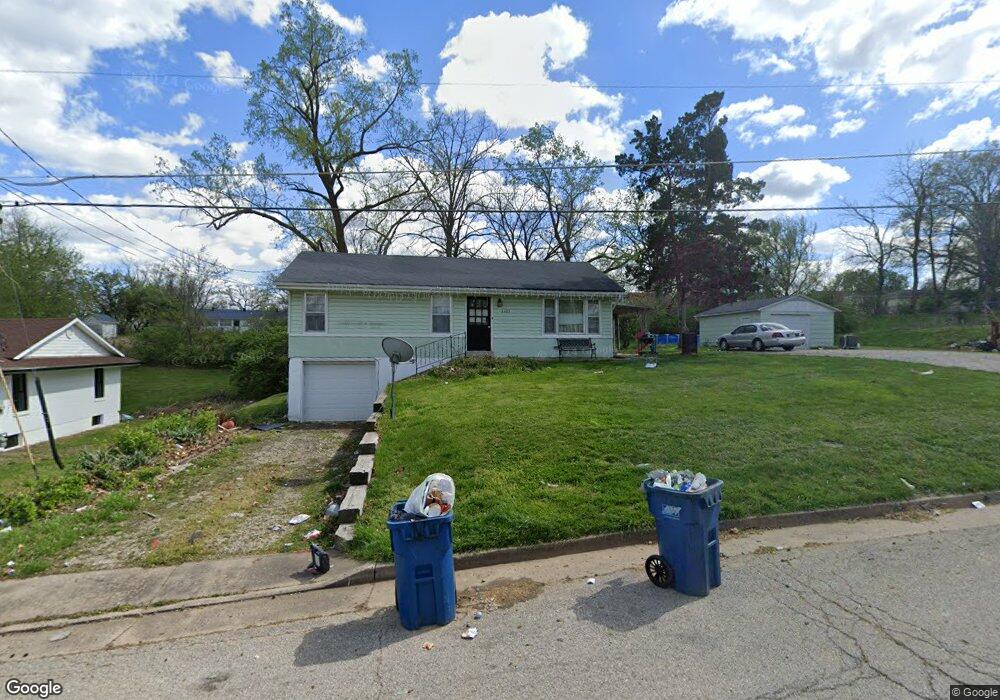
2823 Kenborg Hills Jefferson City, MO 65109
Estimated Value: $160,000 - $245,000
3
Beds
1
Bath
1,164
Sq Ft
$175/Sq Ft
Est. Value
About This Home
This home is located at 2823 Kenborg Hills, Jefferson City, MO 65109 and is currently estimated at $203,667, approximately $174 per square foot. 2823 Kenborg Hills is a home located in Cole County with nearby schools including West Elementary School, Thomas Jefferson Middle School, and Capital City High School.
Ownership History
Date
Name
Owned For
Owner Type
Purchase Details
Closed on
Feb 14, 2025
Sold by
Prenger Ronald J
Bought by
Sorensen Homes Llc
Current Estimated Value
Home Financials for this Owner
Home Financials are based on the most recent Mortgage that was taken out on this home.
Original Mortgage
$400,000
Outstanding Balance
$397,632
Interest Rate
6.93%
Mortgage Type
Credit Line Revolving
Estimated Equity
-$193,965
Purchase Details
Closed on
Apr 6, 2020
Sold by
Wunderlich Nolan and Wunderlich Colin
Bought by
Prenger Ronald J and Prenger Marjorie A
Home Financials for this Owner
Home Financials are based on the most recent Mortgage that was taken out on this home.
Original Mortgage
$790,000
Interest Rate
3.2%
Mortgage Type
Stand Alone Refi Refinance Of Original Loan
Create a Home Valuation Report for This Property
The Home Valuation Report is an in-depth analysis detailing your home's value as well as a comparison with similar homes in the area
Home Values in the Area
Average Home Value in this Area
Purchase History
| Date | Buyer | Sale Price | Title Company |
|---|---|---|---|
| Sorensen Homes Llc | -- | None Listed On Document | |
| Sorensen Homes Llc | -- | None Listed On Document | |
| Prenger Ronald J | -- | None Available |
Source: Public Records
Mortgage History
| Date | Status | Borrower | Loan Amount |
|---|---|---|---|
| Open | Sorensen Homes Llc | $400,000 | |
| Closed | Sorensen Homes Llc | $400,000 | |
| Previous Owner | Prenger Ronald J | $790,000 |
Source: Public Records
Tax History Compared to Growth
Tax History
| Year | Tax Paid | Tax Assessment Tax Assessment Total Assessment is a certain percentage of the fair market value that is determined by local assessors to be the total taxable value of land and additions on the property. | Land | Improvement |
|---|---|---|---|---|
| 2025 | $749 | $13,950 | $1,900 | $12,050 |
| 2024 | $749 | $12,560 | $0 | $12,560 |
| 2023 | $749 | $12,560 | $0 | $12,560 |
| 2022 | $751 | $12,560 | $0 | $12,560 |
| 2021 | $756 | $12,560 | $0 | $12,560 |
| 2020 | $765 | $12,996 | $1,900 | $11,096 |
| 2019 | $744 | $12,369 | $1,900 | $10,469 |
| 2018 | $743 | $12,008 | $1,900 | $10,108 |
| 2017 | $725 | $12,559 | $1,900 | $10,659 |
| 2016 | -- | $12,559 | $1,900 | $10,659 |
| 2015 | $620 | $0 | $0 | $0 |
| 2014 | $620 | $12,559 | $1,900 | $10,659 |
Source: Public Records
Map
Nearby Homes
- 2901 Kenborg Hills
- 401 Windridge Ct
- 3120 Country Club Dr
- 0 Commerce Dr
- 2616 Huntleigh Place
- 1330 Missouri Blvd
- 3131 Country Club Dr
- 0 Frog Hollow Rd
- 915 Diamond Ridge
- 3239 Smith Ct
- 3215 Masonic Ct
- 0 Wildwood Dr
- 0 Jaycee Dr
- 2109 Julie Ln
- 721 Heisinger Rd
- 3242 W Truman Blvd
- 835 Maywood Dr
- 2120 Saint Marys Blvd Unit B4
- 820 Pin Oak Terrace
- 1609 Notting Hill Dr
- 2821 Kenborg Hills
- 2821 Kenborg Rd
- 2852 S 10 Mile Dr
- 2852 S Ten Mile Dr
- 2901 Kenborg Rd
- 2854 S 10 Mile Dr
- 2815 Kenborg Hills
- 2848 S 10 Mile Dr
- 2822 Kenborg Hills
- 2900 S 10 Mile Dr
- 2820 Kenborg Hills
- 2848 S Ten Mile Dr
- 2816 Kenborg Hills
- 2902 S 10 Mile Dr
- 2902 S Ten Mile Dr
- 2905 Kenborg Hills
- 2813 Kenborg Hills
- 2840 S 10 Mile Dr
- 2840 S Ten Mile Dr
- 2814 Kenborg Hills