Estimated Value: $400,000 - $504,000
4
Beds
2
Baths
1,684
Sq Ft
$254/Sq Ft
Est. Value
About This Home
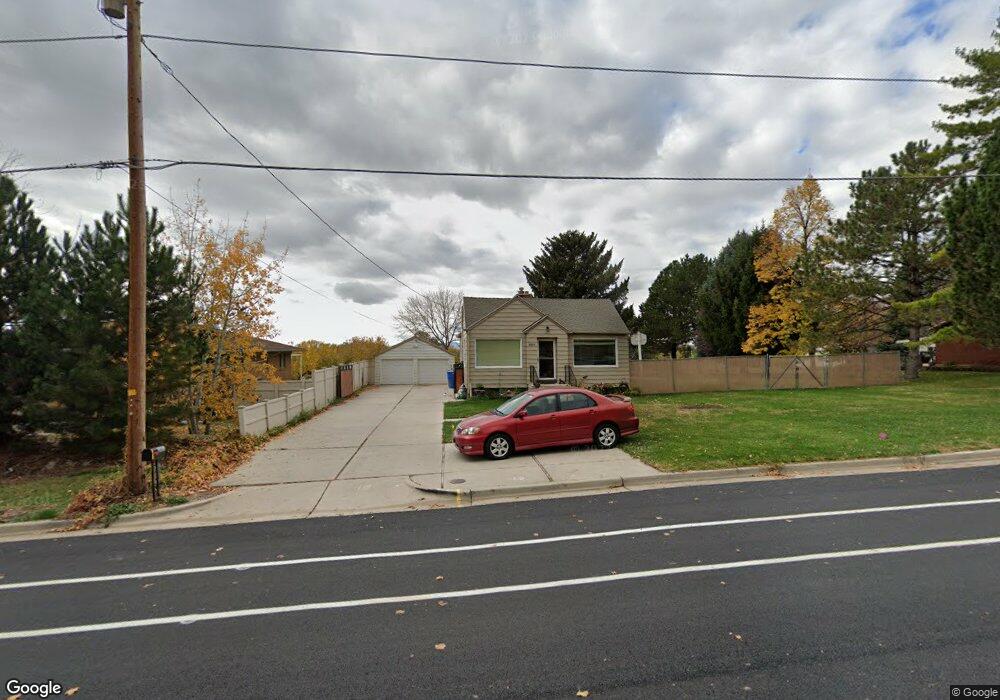
This home is located at 2823 N 400 E, Ogden, UT 84414 and is currently estimated at $428,233, approximately $254 per square foot. 2823 N 400 E is a home located in Weber County with nearby schools including North Ogden School, North Ogden Junior High School, and Weber High School.
Ownership History
Date
Name
Owned For
Owner Type
Purchase Details
Closed on
Aug 10, 2020
Sold by
Reitan Kenneth and Reitan Merissa
Bought by
Garcia Linda
Current Estimated Value
Home Financials for this Owner
Home Financials are based on the most recent Mortgage that was taken out on this home.
Original Mortgage
$294,566
Outstanding Balance
$261,783
Interest Rate
3.1%
Mortgage Type
FHA
Estimated Equity
$166,450
Purchase Details
Closed on
Feb 12, 2008
Sold by
Barker Tyson James
Bought by
Barker Tyson James and Barker Jacquelyn
Purchase Details
Closed on
Sep 9, 2005
Sold by
Barker Hazel A
Bought by
Barker Tyson James
Home Financials for this Owner
Home Financials are based on the most recent Mortgage that was taken out on this home.
Original Mortgage
$80,000
Interest Rate
5.7%
Mortgage Type
Fannie Mae Freddie Mac
Purchase Details
Closed on
Apr 6, 2001
Sold by
Barker Ross J and Barker Hazel A
Bought by
Barker Ross J and Barker Hazel A
Create a Home Valuation Report for This Property
The Home Valuation Report is an in-depth analysis detailing your home's value as well as a comparison with similar homes in the area
Home Values in the Area
Average Home Value in this Area
Purchase History
| Date | Buyer | Sale Price | Title Company |
|---|---|---|---|
| Garcia Linda | -- | Stewart Title | |
| Barker Tyson James | -- | None Available | |
| Barker Tyson James | -- | Inwest Title Ogden | |
| Barker Ross J | -- | -- |
Source: Public Records
Mortgage History
| Date | Status | Borrower | Loan Amount |
|---|---|---|---|
| Open | Garcia Linda | $294,566 | |
| Previous Owner | Barker Tyson James | $80,000 |
Source: Public Records
Tax History
| Year | Tax Paid | Tax Assessment Tax Assessment Total Assessment is a certain percentage of the fair market value that is determined by local assessors to be the total taxable value of land and additions on the property. | Land | Improvement |
|---|---|---|---|---|
| 2025 | $2,604 | $371,578 | $138,028 | $233,550 |
| 2024 | $2,473 | $201,849 | $75,915 | $125,934 |
| 2023 | $2,577 | $215,599 | $71,156 | $144,443 |
| 2022 | $2,468 | $212,300 | $61,730 | $150,570 |
| 2021 | $1,977 | $287,000 | $60,111 | $226,889 |
| 2020 | $1,900 | $258,000 | $50,337 | $207,663 |
| 2019 | $1,758 | $228,000 | $45,116 | $182,884 |
| 2018 | $1,587 | $195,000 | $45,116 | $149,884 |
| 2017 | $1,369 | $156,000 | $45,043 | $110,957 |
| 2016 | $1,254 | $76,486 | $20,362 | $56,124 |
| 2015 | $1,251 | $76,486 | $20,362 | $56,124 |
| 2014 | $1,272 | $76,487 | $20,362 | $56,125 |
Source: Public Records
Map
Nearby Homes
- 2735 N 400 E
- 2881 N 450 E
- 210 E Lomond View Dr
- 204 E Lomond View Dr
- 2989 N 300 E
- 3878 N 475 E Unit 33
- 3629 N 475 E Unit 1
- 566 E 3050 N
- 2573 N 550 E
- 1396 W Caribou Ct Unit 110
- 1376 W Caribou Ct Unit 108
- 3642 N 800 E
- 1404 W Caribou Ct N Unit 111
- 1383 W Caribou Ct Unit 113
- 1364 W Caribou Ct Unit 107
- 1177 W 3390 N Unit 221
- 1278 W Caribou Ct N
- 2543 N 525 E
- 325 E 2550 N Unit 17
- 325 E 2550 N Unit 97
- 2815 N 400 E
- 2839 N 400 E
- 2801 N 400 E
- 2849 N 400 E
- 4753 N Washington Blvd Unit 52
- 2804 N 400 E
- 383 E Elberta Dr
- 2816 N 400 E
- 2828 N 400 E
- 2771 N 400 E
- 371 E Elberta Dr
- 410 E 2850 N
- 2302 N 400 E
- 2346 N 400 E Unit 50
- 2550 N 400 E
- 2412 N 400 E
- 2124 N 400 E Unit Y2
- 2290 N 400 E
- 2312 N 400 E
- 2271 N 400 E Unit 3C
Your Personal Tour Guide
Ask me questions while you tour the home.