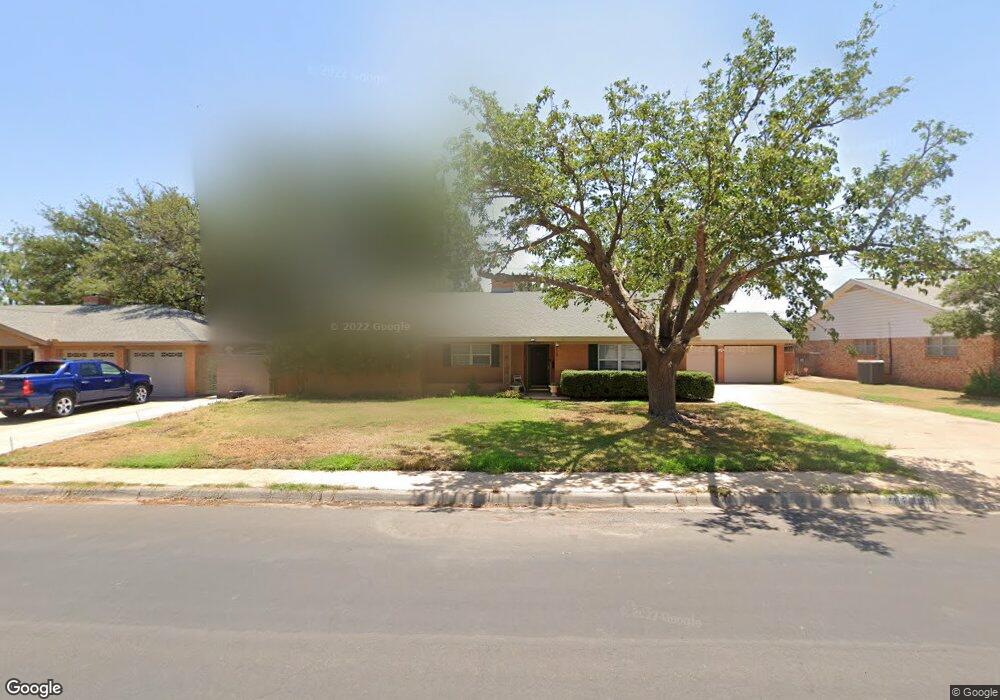
2823 W Dengar Ave Midland, TX 79705
Estimated Value: $360,461 - $408,000
--
Bed
2
Baths
2,207
Sq Ft
$172/Sq Ft
Est. Value
About This Home
This home is located at 2823 W Dengar Ave, Midland, TX 79705 and is currently estimated at $379,615, approximately $172 per square foot. 2823 W Dengar Ave is a home located in Midland County with nearby schools including Fannin Elementary School, Midland High School, and Midland Christian School.
Ownership History
Date
Name
Owned For
Owner Type
Purchase Details
Closed on
May 14, 2007
Sold by
Simon Peter J and Simon Kimberlee
Bought by
Robertson George G and Robertson Beverly J
Current Estimated Value
Home Financials for this Owner
Home Financials are based on the most recent Mortgage that was taken out on this home.
Original Mortgage
$156,000
Outstanding Balance
$94,218
Interest Rate
6.13%
Mortgage Type
Purchase Money Mortgage
Estimated Equity
$285,397
Purchase Details
Closed on
Apr 25, 2005
Sold by
Murff James and Murff Julie
Bought by
Simon Peter J
Home Financials for this Owner
Home Financials are based on the most recent Mortgage that was taken out on this home.
Original Mortgage
$133,929
Interest Rate
5.93%
Mortgage Type
FHA
Purchase Details
Closed on
Nov 26, 1997
Bought by
Robertson George Galloway
Purchase Details
Closed on
Oct 28, 1991
Bought by
Robertson George Galloway
Purchase Details
Closed on
Feb 1, 1984
Bought by
Robertson George Galloway
Create a Home Valuation Report for This Property
The Home Valuation Report is an in-depth analysis detailing your home's value as well as a comparison with similar homes in the area
Home Values in the Area
Average Home Value in this Area
Purchase History
| Date | Buyer | Sale Price | Title Company |
|---|---|---|---|
| Robertson George G | -- | None Available | |
| Simon Peter J | -- | None Available | |
| Robertson George Galloway | -- | -- | |
| Robertson George Galloway | -- | -- | |
| Robertson George Galloway | -- | -- |
Source: Public Records
Mortgage History
| Date | Status | Borrower | Loan Amount |
|---|---|---|---|
| Open | Robertson George G | $156,000 | |
| Previous Owner | Simon Peter J | $133,929 |
Source: Public Records
Tax History Compared to Growth
Tax History
| Year | Tax Paid | Tax Assessment Tax Assessment Total Assessment is a certain percentage of the fair market value that is determined by local assessors to be the total taxable value of land and additions on the property. | Land | Improvement |
|---|---|---|---|---|
| 2025 | $3,371 | $286,230 | $23,900 | $262,330 |
| 2024 | $3,377 | $298,150 | $23,900 | $274,250 |
| 2023 | $3,213 | $290,600 | $23,900 | $266,700 |
| 2022 | $4,362 | $279,190 | $23,900 | $255,290 |
| 2021 | $4,569 | $262,250 | $23,900 | $238,350 |
| 2020 | $4,341 | $250,460 | $23,900 | $226,560 |
| 2019 | $4,631 | $244,610 | $23,900 | $226,560 |
| 2018 | $4,324 | $222,370 | $23,900 | $198,470 |
| 2017 | $4,341 | $223,280 | $23,900 | $199,380 |
| 2016 | $4,303 | $220,920 | $23,900 | $197,020 |
| 2015 | -- | $220,920 | $23,900 | $197,020 |
| 2014 | -- | $208,670 | $23,900 | $184,770 |
Source: Public Records
Map
Nearby Homes
- 2824 Cimmaron Ave
- 3200 Whitney Dr
- 3210 Cimmaron Ave
- 3 Marinor Ct
- 2800 Cimmaron Ave
- 3227 W Dengar Ave
- 3200 W Wadley Ave
- 3204 W Wadley Ave
- 3231 W Dengar Ave
- 3235 W Shandon Ave
- 4 Amhurst Ct
- 2601 W Dengar Ave
- 2811 Durant Dr
- 3200 Durant Dr
- 3308 W Dengar Ave
- 2605 Inwood Ct
- 63 Ironwood Ct Unit 91
- 63 Ironwood Ct
- 3101 Stanolind Ave
- 3207 Marmon Dr
- 2825 W Dengar Ave
- 2821 W Dengar Ave
- 2826 Cimmaron Ave
- 2822 Cimmaron Ave
- 2824 W Dengar Ave
- 2819 W Dengar Ave
- 2822 W Dengar Ave
- 2826 W Dengar Ave
- 2820 Cimmaron Ave
- 3201 W Dengar Ave
- 2820 W Dengar Ave
- 3200 Cimmaron Ave
- 3200 W Dengar Ave
- 3203 W Dengar Ave
- 2818 Cimmaron Ave
- 2817 W Dengar Ave
- 2825 W Shandon Ave
- 2825 Cimmaron Ave
- 2818 W Dengar Ave
- 2827 W Shandon Ave