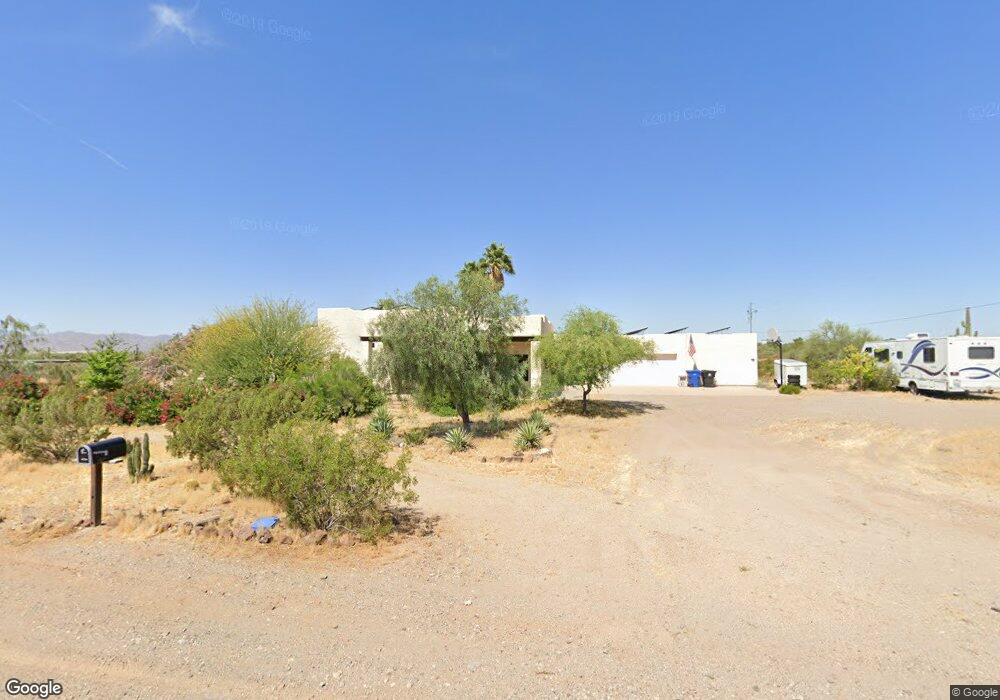
28236 N 166th Ave Unit 1 Surprise, AZ 85387
Estimated Value: $626,000 - $691,000
4
Beds
2
Baths
1,996
Sq Ft
$330/Sq Ft
Est. Value
About This Home
This home is located at 28236 N 166th Ave Unit 1, Surprise, AZ 85387 and is currently estimated at $658,695, approximately $330 per square foot. 28236 N 166th Ave Unit 1 is a home located in Maricopa County with nearby schools including Desert Oasis Elementary School.
Ownership History
Date
Name
Owned For
Owner Type
Purchase Details
Closed on
Mar 21, 2017
Sold by
Pomasi Antoinette
Bought by
Pomasl Christopher J
Current Estimated Value
Home Financials for this Owner
Home Financials are based on the most recent Mortgage that was taken out on this home.
Original Mortgage
$277,500
Outstanding Balance
$230,054
Interest Rate
4.16%
Mortgage Type
New Conventional
Estimated Equity
$428,641
Purchase Details
Closed on
Apr 8, 2008
Sold by
Stpeter Sharron and Stpeter Case
Bought by
Bresztyenszky Rezso A and Bresztyenszky Veronica M
Purchase Details
Closed on
Mar 4, 2008
Sold by
Morse Bonnie K and Morse Neil
Bought by
Stpeter Sharron and Stpeter Case
Purchase Details
Closed on
Sep 6, 2007
Sold by
Morse Bonnie K and Morse Neil
Bought by
St Peter Sharron and St Peter Case
Purchase Details
Closed on
Nov 28, 2005
Sold by
Morse Bonnie and Morse Neil
Bought by
Morse Bonnie K and Morse Neil
Create a Home Valuation Report for This Property
The Home Valuation Report is an in-depth analysis detailing your home's value as well as a comparison with similar homes in the area
Home Values in the Area
Average Home Value in this Area
Purchase History
| Date | Buyer | Sale Price | Title Company |
|---|---|---|---|
| Pomasl Christopher J | -- | Driggs Title Agency Inc | |
| Pomasl Christopher J | $382,500 | Driggs Title Agency Inc | |
| Bresztyenszky Rezso A | $350,000 | The Talon Group Kierland | |
| Stpeter Sharron | -- | None Available | |
| St Peter Sharron | $350,000 | None Available | |
| Morse Bonnie K | -- | -- |
Source: Public Records
Mortgage History
| Date | Status | Borrower | Loan Amount |
|---|---|---|---|
| Open | Pomasl Christopher J | $277,500 | |
| Closed | Pomasl Christopher J | $277,500 |
Source: Public Records
Tax History Compared to Growth
Tax History
| Year | Tax Paid | Tax Assessment Tax Assessment Total Assessment is a certain percentage of the fair market value that is determined by local assessors to be the total taxable value of land and additions on the property. | Land | Improvement |
|---|---|---|---|---|
| 2025 | $1,777 | $21,379 | -- | -- |
| 2024 | $2,112 | $20,361 | -- | -- |
| 2023 | $2,112 | $41,930 | $8,380 | $33,550 |
| 2022 | $1,601 | $29,380 | $5,870 | $23,510 |
| 2021 | $1,867 | $27,100 | $5,420 | $21,680 |
| 2020 | $1,900 | $25,500 | $5,100 | $20,400 |
| 2019 | $1,480 | $24,180 | $4,830 | $19,350 |
| 2018 | $1,262 | $18,560 | $3,710 | $14,850 |
| 2017 | $1,238 | $18,560 | $3,710 | $14,850 |
| 2016 | $1,645 | $18,560 | $3,710 | $14,850 |
| 2015 | $1,660 | $17,970 | $3,590 | $14,380 |
Source: Public Records
Map
Nearby Homes
- 16804 W Dale Ln Unit 1-4
- 25220 N 165th Ave
- 32612 N 163rd Ave Unit 16
- 0 N 163rd Ave Unit 3 6881113
- 17160 W Running Deer Trail
- 16873 W Fetlock Trail
- 17159 W Blue Sky Dr
- 27318 N 162nd Dr
- 27304 N 162nd Dr
- 16237 W Straight Arrow Ln
- 17187 W Blue Sky Dr
- 16231 W Straight Arrow Ln
- 27290 N 162nd Dr
- 17194 W Blue Sky Dr
- 16934 W Buckhorn Trail
- 17174 W Oberlin Way
- 17165 W Oberlin Way
- 17182 W Oberlin Way
- 16230 W Pinnacle Vista Dr
- 16224 W Pinnacle Vista Dr
- 28236 N 166th Ave
- 28264 N 166th Ave
- 28624 N 166th Ave Unit A
- 28624 N 166th Ave
- 28624 N 166th Ave
- 28624 N 166th Ave
- 28624 N 166th Ave
- 16531 W Dale Ln
- 000 W Dale Ln Unit 503-51-136-A
- 16629 W Dale Ln Unit A
- 16511 W Dale Ln
- 16600 W Dale Ln Unit 1
- 28625 N 167th Ave Unit 503-51-136-B
- 0 W Dale Ave Unit 6054633
- 16274 W Dale Ln
- 161xx W Dale Ln
- XXXX W Dale Ln
- XXXX W Dale Ln
- 153xx W Dale Ln
- 16930 W Dale Ln