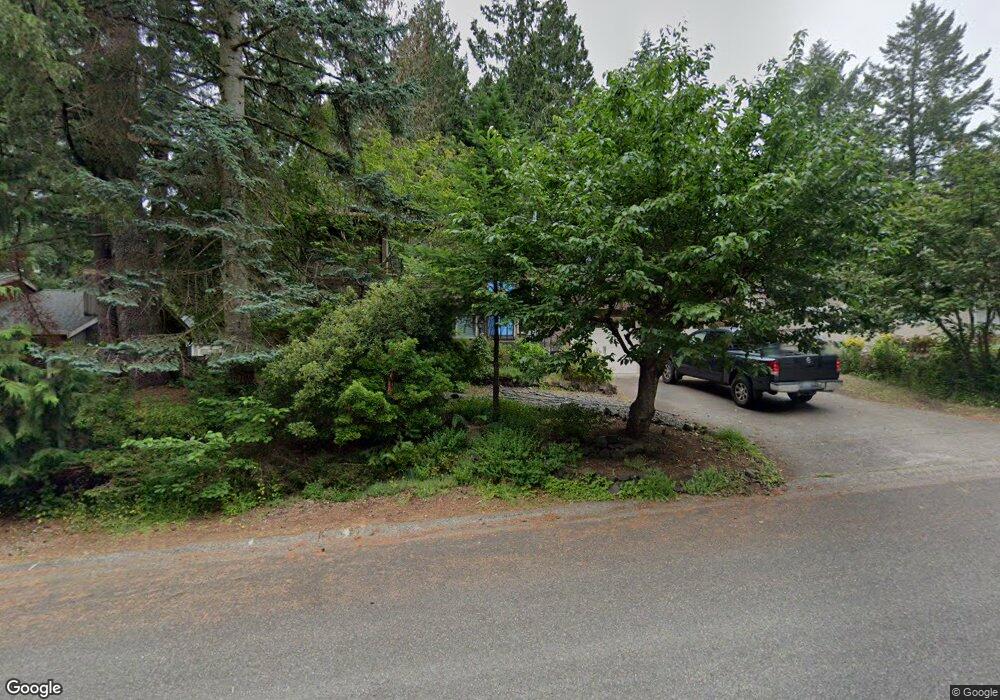
2824 Langridge Loop NW Olympia, WA 98502
Estimated Value: $591,000 - $635,000
4
Beds
3
Baths
1,448
Sq Ft
$422/Sq Ft
Est. Value
About This Home
This home is located at 2824 Langridge Loop NW, Olympia, WA 98502 and is currently estimated at $611,544, approximately $422 per square foot. 2824 Langridge Loop NW is a home located in Thurston County with nearby schools including Garfield Elementary School, Jefferson Middle School, and Capital High School.
Ownership History
Date
Name
Owned For
Owner Type
Purchase Details
Closed on
May 5, 2016
Sold by
Petersen Christopher V and Petersen Vickie K
Bought by
Canright Paul D and Canright Elisabeth M
Current Estimated Value
Home Financials for this Owner
Home Financials are based on the most recent Mortgage that was taken out on this home.
Original Mortgage
$204,000
Outstanding Balance
$161,974
Interest Rate
3.58%
Mortgage Type
New Conventional
Estimated Equity
$449,570
Purchase Details
Closed on
Aug 16, 2001
Sold by
Smith Joseph B and Smith Julie A
Bought by
Petersen Christopher and Petersen Vickie K
Home Financials for this Owner
Home Financials are based on the most recent Mortgage that was taken out on this home.
Original Mortgage
$145,600
Interest Rate
7.09%
Create a Home Valuation Report for This Property
The Home Valuation Report is an in-depth analysis detailing your home's value as well as a comparison with similar homes in the area
Home Values in the Area
Average Home Value in this Area
Purchase History
| Date | Buyer | Sale Price | Title Company |
|---|---|---|---|
| Canright Paul D | $254,719 | First American Title | |
| Petersen Christopher | $182,000 | Transnation Title Insurance |
Source: Public Records
Mortgage History
| Date | Status | Borrower | Loan Amount |
|---|---|---|---|
| Open | Canright Paul D | $204,000 | |
| Previous Owner | Petersen Christopher | $145,600 | |
| Closed | Petersen Christopher | $27,300 |
Source: Public Records
Tax History Compared to Growth
Tax History
| Year | Tax Paid | Tax Assessment Tax Assessment Total Assessment is a certain percentage of the fair market value that is determined by local assessors to be the total taxable value of land and additions on the property. | Land | Improvement |
|---|---|---|---|---|
| 2024 | $5,739 | $553,100 | $168,700 | $384,400 |
| 2023 | $5,739 | $548,800 | $143,400 | $405,400 |
| 2022 | $5,089 | $531,900 | $112,600 | $419,300 |
| 2021 | $4,612 | $425,900 | $96,500 | $329,400 |
| 2020 | $4,585 | $357,200 | $100,700 | $256,500 |
| 2019 | $3,930 | $346,400 | $58,600 | $287,800 |
| 2018 | $3,986 | $295,900 | $55,900 | $240,000 |
| 2017 | $3,378 | $270,250 | $57,350 | $212,900 |
| 2016 | $3,045 | $250,600 | $62,400 | $188,200 |
| 2014 | -- | $243,400 | $62,400 | $181,000 |
Source: Public Records
Map
Nearby Homes
- 2619 Walnut Loop NW
- 812 Dundee Rd NW
- 1201 Tabitha Ct NW
- 2510 17th Ave NW
- 1807 Marigold St NW
- 1822 Jonquil Ln NW
- 1910 Bowman Ave NW
- 1203 Bowman Ave NW
- 2608 19th Way NW
- 2023 Bush Ave NW
- 1731 Brawne Ave NW Unit B
- 2005 E End St NW
- 236 Milroy St NW
- 3218 6th Ave NW
- 415 Yauger Way NW
- 2201 Sophie Way NW
- 420 Bungalow Dr NW
- 1414 Hummingbird Ln NW
- 123 Rogers St NW
- 101 Rogers St NW
- 2828 Langridge Loop NW
- 2820 Langridge Loop NW
- 2926 Langridge Loop NW
- 2930 Langridge Loop NW
- 2816 Langridge Loop NW
- 2832 Langridge Loop NW
- 2922 Langridge Loop NW
- 2819 Langridge Loop NW
- 2934 Langridge Loop NW
- 2823 Langridge Loop NW
- 2815 Langridge Loop NW
- 2914 Langridge Loop NW
- 2812 Langridge Loop NW
- 2938 Langridge Loop NW
- 2811 Langridge Loop NW
- 2706 Dundee Place NW
- 2831 Langridge Loop NW
- 2714 Dundee Place NW
- 2806 Langridge Loop NW