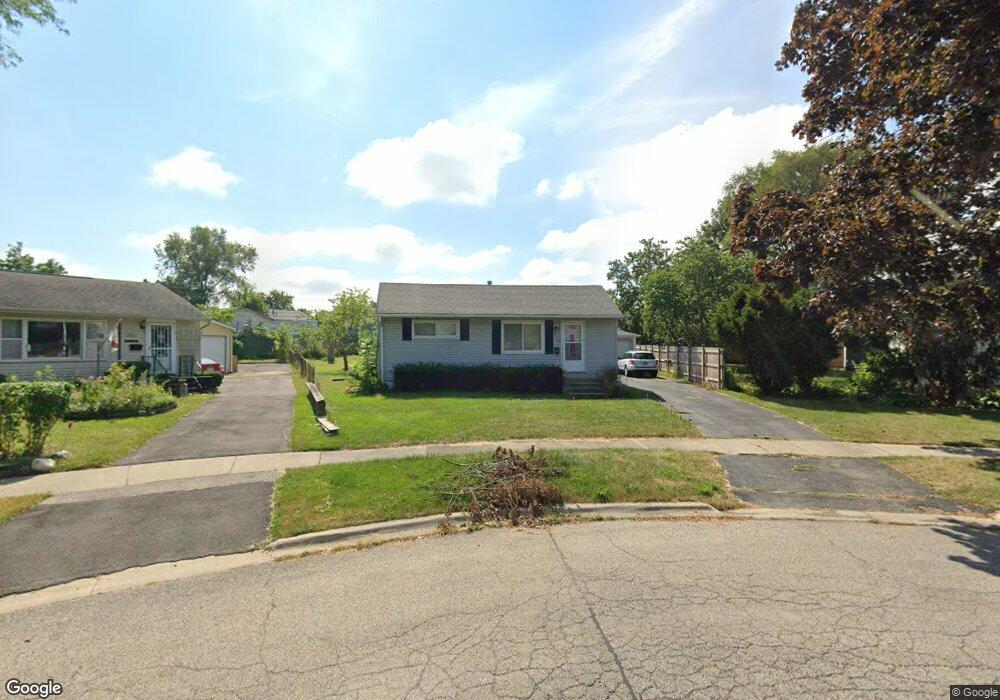
2824 Osage Cir Waukegan, IL 60087
Lake Cogardens NeighborhoodEstimated Value: $215,000 - $280,966
3
Beds
2
Baths
1,182
Sq Ft
$216/Sq Ft
Est. Value
About This Home
This home is located at 2824 Osage Cir, Waukegan, IL 60087 and is currently estimated at $255,492, approximately $216 per square foot. 2824 Osage Cir is a home located in Lake County with nearby schools including Oakdale Elementary School, Jack Benny Middle School, and Waukegan High School.
Ownership History
Date
Name
Owned For
Owner Type
Purchase Details
Closed on
Apr 18, 2016
Sold by
Pottala Christopher D and Shaleen Anna
Bought by
Pottala Christopher D
Current Estimated Value
Home Financials for this Owner
Home Financials are based on the most recent Mortgage that was taken out on this home.
Original Mortgage
$124,150
Outstanding Balance
$54,457
Interest Rate
3.73%
Mortgage Type
New Conventional
Estimated Equity
$201,035
Purchase Details
Closed on
Apr 13, 2006
Sold by
Kutzler Jack H and Kutzler Carrie J
Bought by
Pottala Christopher D
Home Financials for this Owner
Home Financials are based on the most recent Mortgage that was taken out on this home.
Original Mortgage
$146,950
Interest Rate
6.48%
Mortgage Type
Fannie Mae Freddie Mac
Create a Home Valuation Report for This Property
The Home Valuation Report is an in-depth analysis detailing your home's value as well as a comparison with similar homes in the area
Home Values in the Area
Average Home Value in this Area
Purchase History
| Date | Buyer | Sale Price | Title Company |
|---|---|---|---|
| Pottala Christopher D | -- | Fidelity National Title Co | |
| Pottala Christopher D | $151,500 | None Available |
Source: Public Records
Mortgage History
| Date | Status | Borrower | Loan Amount |
|---|---|---|---|
| Open | Pottala Christopher D | $124,150 | |
| Closed | Pottala Christopher D | $146,950 |
Source: Public Records
Tax History Compared to Growth
Tax History
| Year | Tax Paid | Tax Assessment Tax Assessment Total Assessment is a certain percentage of the fair market value that is determined by local assessors to be the total taxable value of land and additions on the property. | Land | Improvement |
|---|---|---|---|---|
| 2024 | $6,405 | $84,038 | $16,098 | $67,940 |
| 2023 | $5,570 | $75,920 | $14,543 | $61,377 |
| 2022 | $5,570 | $62,974 | $13,856 | $49,118 |
| 2021 | $5,109 | $55,007 | $11,995 | $43,012 |
| 2020 | $5,129 | $51,246 | $11,175 | $40,071 |
| 2019 | $5,109 | $46,959 | $10,240 | $36,719 |
| 2018 | $4,256 | $39,302 | $13,044 | $26,258 |
| 2017 | $4,093 | $34,771 | $11,540 | $23,231 |
| 2016 | $3,742 | $30,215 | $10,028 | $20,187 |
| 2015 | $3,555 | $27,043 | $8,975 | $18,068 |
| 2014 | $4,021 | $29,307 | $9,851 | $19,456 |
| 2012 | $5,204 | $31,752 | $10,673 | $21,079 |
Source: Public Records
Map
Nearby Homes
- 2713 Varonen Ave
- 3320 Sunset Ave
- 2705 Dana Ave
- 2928 W Country Club Ave
- 3000 W Country Club Ave
- 2946 W Country Club Ave
- 2708 Dana Ave
- 3032 W Vermont Ave
- 36955 N Garrick Ave
- 2715 W Greenwood Ave
- 1913 Chippewa Rd
- 2440 W Cheyenne Rd
- 12312 W Audrey Ave
- 36245 N Green Bay Rd
- 12933 W Polo Ave
- 2810 W Atlantic Ave
- 2350 N Lewis Ave
- 2207 Williamsburg Dr
- 12535 W Blanchard Rd
- 3436 Florida Ave
- 2820 Osage Cir
- 2828 Osage Cir
- 2225 Ottawa Rd
- 2229 Ottawa Rd
- 2820 Navaho Rd
- 2816 Navaho Rd
- 2221 Ottawa Rd
- 2812 Navaho Rd Unit 3
- 2816 Osage Cir
- 2233 Ottawa Rd
- 2824 Navaho Rd Unit 3
- 2808 Navaho Rd
- 2237 Ottawa Rd
- 2812 Osage Cir
- 2836 Osage Cir
- 2804 Navaho Rd
- 2230 Seminole Rd
- 2241 Ottawa Rd
- 2212 Shawnee Rd
- 2220 Ottawa Rd