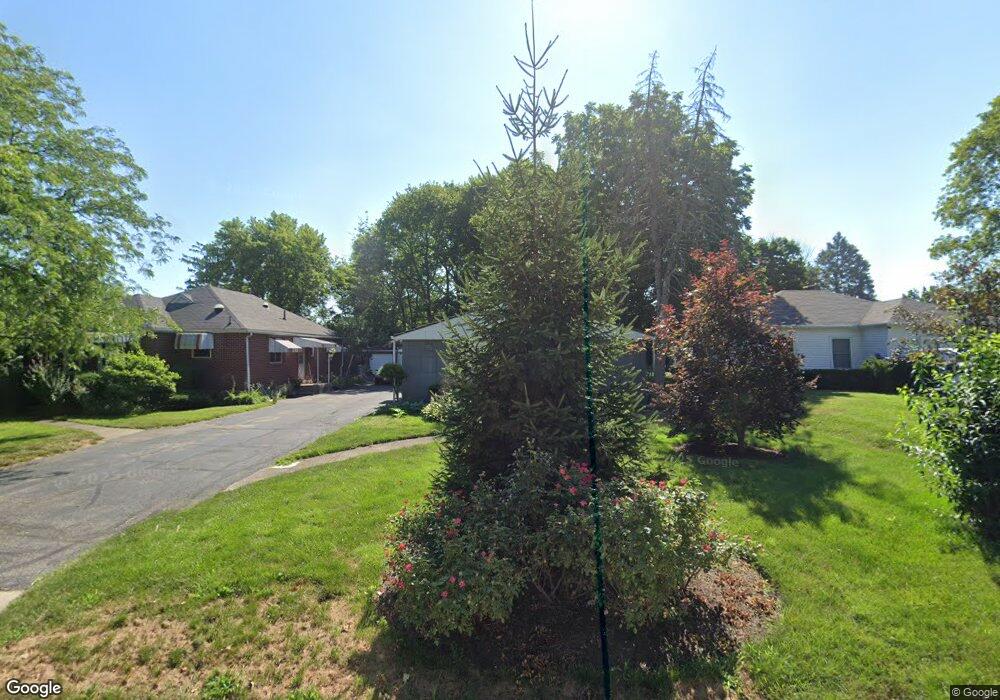
2824 Royalston Ave Dayton, OH 45419
Estimated Value: $195,197 - $227,000
3
Beds
1
Bath
1,217
Sq Ft
$172/Sq Ft
Est. Value
About This Home
This home is located at 2824 Royalston Ave, Dayton, OH 45419 and is currently estimated at $209,549, approximately $172 per square foot. 2824 Royalston Ave is a home located in Montgomery County with nearby schools including Orchard Park Elementary School, Van Buren Middle School, and Kettering Fairmont High School.
Ownership History
Date
Name
Owned For
Owner Type
Purchase Details
Closed on
Jul 25, 2024
Sold by
Wilson Darrell D and Gambone Alexandra N
Bought by
Hd Properties Llc
Current Estimated Value
Purchase Details
Closed on
Jun 23, 2020
Sold by
Jk Real Estate Group Llc
Bought by
Wilson Darrell D and Gambone Alexandra N
Home Financials for this Owner
Home Financials are based on the most recent Mortgage that was taken out on this home.
Original Mortgage
$139,918
Interest Rate
3.1%
Mortgage Type
FHA
Purchase Details
Closed on
Sep 7, 2016
Sold by
Wolters Brian G and Wolters Emily
Bought by
Jk Real Estate Group Llc
Purchase Details
Closed on
Jul 21, 2006
Sold by
Tavenner Eugene F
Bought by
Wolters Brian G
Home Financials for this Owner
Home Financials are based on the most recent Mortgage that was taken out on this home.
Original Mortgage
$70,125
Interest Rate
6.82%
Mortgage Type
Purchase Money Mortgage
Create a Home Valuation Report for This Property
The Home Valuation Report is an in-depth analysis detailing your home's value as well as a comparison with similar homes in the area
Home Values in the Area
Average Home Value in this Area
Purchase History
| Date | Buyer | Sale Price | Title Company |
|---|---|---|---|
| Hd Properties Llc | $170,000 | None Listed On Document | |
| Wilson Darrell D | $142,500 | Vantage Land Title | |
| Jk Real Estate Group Llc | $128,300 | Fidelity Lawyers Title Agenc | |
| Wolters Brian G | $70,200 | None Available |
Source: Public Records
Mortgage History
| Date | Status | Borrower | Loan Amount |
|---|---|---|---|
| Previous Owner | Wilson Darrell D | $139,918 | |
| Previous Owner | Wolters Brian G | $70,125 |
Source: Public Records
Tax History Compared to Growth
Tax History
| Year | Tax Paid | Tax Assessment Tax Assessment Total Assessment is a certain percentage of the fair market value that is determined by local assessors to be the total taxable value of land and additions on the property. | Land | Improvement |
|---|---|---|---|---|
| 2024 | $2,615 | $42,040 | $14,090 | $27,950 |
| 2023 | $2,615 | $42,040 | $14,090 | $27,950 |
| 2022 | $2,486 | $31,600 | $10,590 | $21,010 |
| 2021 | $2,352 | $31,600 | $10,590 | $21,010 |
| 2020 | $2,309 | $31,600 | $10,590 | $21,010 |
| 2019 | $3,716 | $44,180 | $9,620 | $34,560 |
| 2018 | $3,736 | $44,180 | $9,620 | $34,560 |
| 2017 | $3,449 | $44,180 | $9,620 | $34,560 |
| 2016 | $2,384 | $29,330 | $9,620 | $19,710 |
| 2015 | $2,278 | $29,330 | $9,620 | $19,710 |
| 2014 | $2,278 | $29,330 | $9,620 | $19,710 |
| 2012 | -- | $29,730 | $9,220 | $20,510 |
Source: Public Records
Map
Nearby Homes
- 2817 Royalston Ave
- 651 Broad Blvd
- 663 Broad Blvd
- 2701 Aerial Ave
- 709 E Dorothy Ln
- 2820 Wehrly Ave
- 2601 Oakley Ave
- 545 Monteray Ave
- 445 Peach Orchard Ave
- 349 Orchard Dr
- 436 Monteray Ave
- 2119 Shroyer Rd
- 2551 Acorn Dr
- 441 Cushing Ave
- 813 Rockhill Ave
- 320 Brydon Rd
- 2905 Acorn Dr
- 962 Broad Blvd
- 2004 Shroyer Rd
- 587 Cottingwood Ct
- 2820 Royalston Ave
- 2828 Royalston Ave
- 2816 Royalston Ave
- 2812 Royalston Ave
- 651 East Dr
- 2813 Hazelwood Ave
- 2817 Hazelwood Ave
- 655 East Dr
- 2808 Royalston Ave
- 2809 Hazelwood Ave
- 650 Broad Blvd
- 2813 Royalston Ave
- 2821 Royalston Ave
- 659 East Dr
- 640 Broad Blvd
- 2809 Royalston Ave
- 620 Broad Blvd
- 654 Broad Blvd
- 650 East Dr
- 611 East Dr