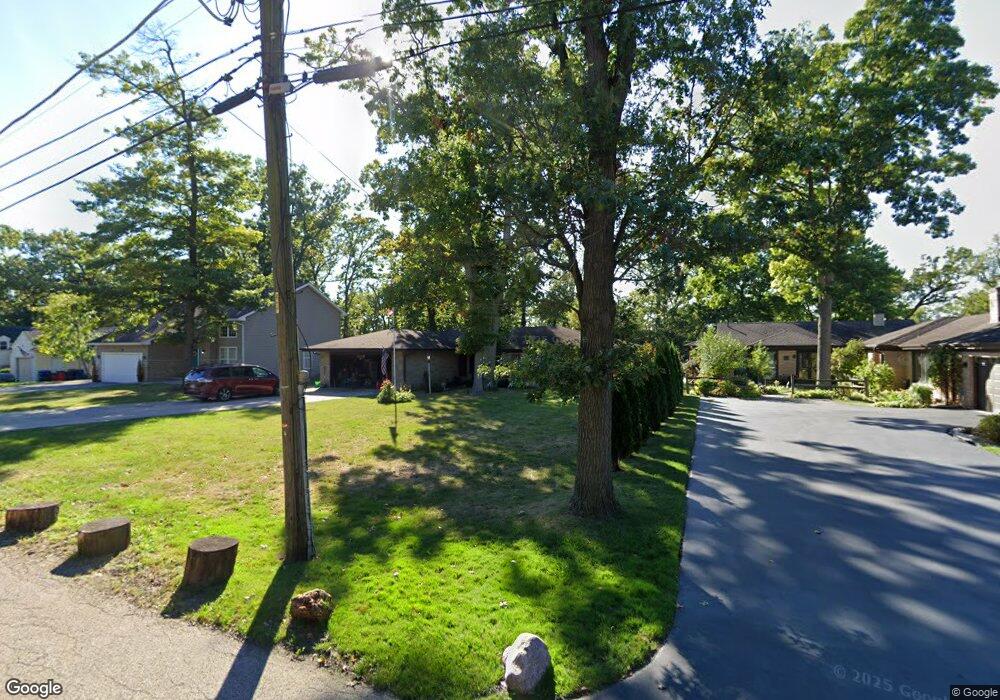
2824 W Bonnie Brook Ln Waukegan, IL 60087
Bonnie Brook NeighborhoodEstimated Value: $253,000 - $313,000
--
Bed
2
Baths
1,669
Sq Ft
$172/Sq Ft
Est. Value
About This Home
This home is located at 2824 W Bonnie Brook Ln, Waukegan, IL 60087 and is currently estimated at $286,768, approximately $171 per square foot. 2824 W Bonnie Brook Ln is a home located in Lake County with nearby schools including Oakdale Elementary School, Jack Benny Middle School, and Waukegan High School.
Ownership History
Date
Name
Owned For
Owner Type
Purchase Details
Closed on
Dec 31, 2024
Sold by
Sargent Diane
Bought by
Diane Sargent Declaration Of Trust and Sargent
Current Estimated Value
Purchase Details
Closed on
Aug 30, 2000
Sold by
Voight Carol L
Bought by
Grant Ronald T and Grant Deborah A
Home Financials for this Owner
Home Financials are based on the most recent Mortgage that was taken out on this home.
Original Mortgage
$60,000
Interest Rate
8.14%
Purchase Details
Closed on
May 14, 1999
Sold by
Nero Joseph E and Nero Florence M
Bought by
Voight Donald and Voight Carol L
Home Financials for this Owner
Home Financials are based on the most recent Mortgage that was taken out on this home.
Original Mortgage
$127,100
Interest Rate
6.99%
Create a Home Valuation Report for This Property
The Home Valuation Report is an in-depth analysis detailing your home's value as well as a comparison with similar homes in the area
Home Values in the Area
Average Home Value in this Area
Purchase History
| Date | Buyer | Sale Price | Title Company |
|---|---|---|---|
| Diane Sargent Declaration Of Trust | -- | None Listed On Document | |
| Diane Sargent Declaration Of Trust | -- | None Listed On Document | |
| Grant Ronald T | $20,000 | -- | |
| Sargent Clifton A | $160,000 | -- | |
| Voight Donald | $178,000 | Standard Title |
Source: Public Records
Mortgage History
| Date | Status | Borrower | Loan Amount |
|---|---|---|---|
| Previous Owner | Sargent Clifton A | $60,000 | |
| Previous Owner | Voight Donald | $127,100 | |
| Closed | Voight Donald | $33,000 |
Source: Public Records
Tax History Compared to Growth
Tax History
| Year | Tax Paid | Tax Assessment Tax Assessment Total Assessment is a certain percentage of the fair market value that is determined by local assessors to be the total taxable value of land and additions on the property. | Land | Improvement |
|---|---|---|---|---|
| 2024 | $5,635 | $86,221 | $15,459 | $70,762 |
| 2023 | $1,599 | $77,761 | $13,943 | $63,818 |
| 2022 | $1,599 | $72,016 | $16,417 | $55,599 |
| 2021 | $5,309 | $61,918 | $14,395 | $47,523 |
| 2020 | $1,854 | $57,684 | $13,411 | $44,273 |
| 2019 | $5,229 | $52,858 | $12,289 | $40,569 |
| 2018 | $3,877 | $56,802 | $16,846 | $39,956 |
| 2017 | $5,584 | $50,254 | $14,904 | $35,350 |
| 2016 | $4,272 | $38,645 | $11,461 | $27,184 |
| 2015 | $3,100 | $34,588 | $10,258 | $24,330 |
| 2014 | $3,248 | $29,353 | $10,122 | $19,231 |
| 2012 | $4,586 | $31,800 | $10,965 | $20,835 |
Source: Public Records
Map
Nearby Homes
- 3101 Country Club Ln
- 12312 W Audrey Ave
- 2708 Dana Ave
- 3211 Rugby Ct
- 2705 Dana Ave
- 2613 N Lewis Ave
- 2713 Varonen Ave
- 1612 Whitney St
- 1636 Rice St
- 2350 N Lewis Ave
- 36955 N Garrick Ave
- 37966 N Cornell Rd
- 3032 W Vermont Ave
- 3411 N Lewis Ave
- 36245 N Green Bay Rd
- 3320 Sunset Ave
- 12535 W Blanchard Rd
- 2928 W Country Club Ave
- 3000 W Country Club Ave
- 2946 W Country Club Ave
- 2830 W Bonnie Brook Ln
- 2818 W Bonnie Brook Ln
- 2812 W Bonnie Brook Ln
- 2836 W Bonnie Brook Ln
- 2806 W Bonnie Brook Ln
- 2842 W Bonnie Brook Ln
- 2823 W Bonnie Brook Ln
- 37284 N Mcaree Rd
- 2817 W Bonnie Brook Ln
- 2829 W Bonnie Brook Ln
- 2811 W Bonnie Brook Ln
- 2515 N Bonnie Brook Ln Unit W
- 2754 W Bonnie Brook Ln
- 2754 W Bonnie Brook Ln
- 2835 W Bonnie Brook Ln
- 12018 Vercoe Ave
- 2805 W Bonnie Brook Ln
- 2748 W Bonnie Brook Ln
- 2841 W Bonnie Brook Ln
- 12041 W Graves Ave