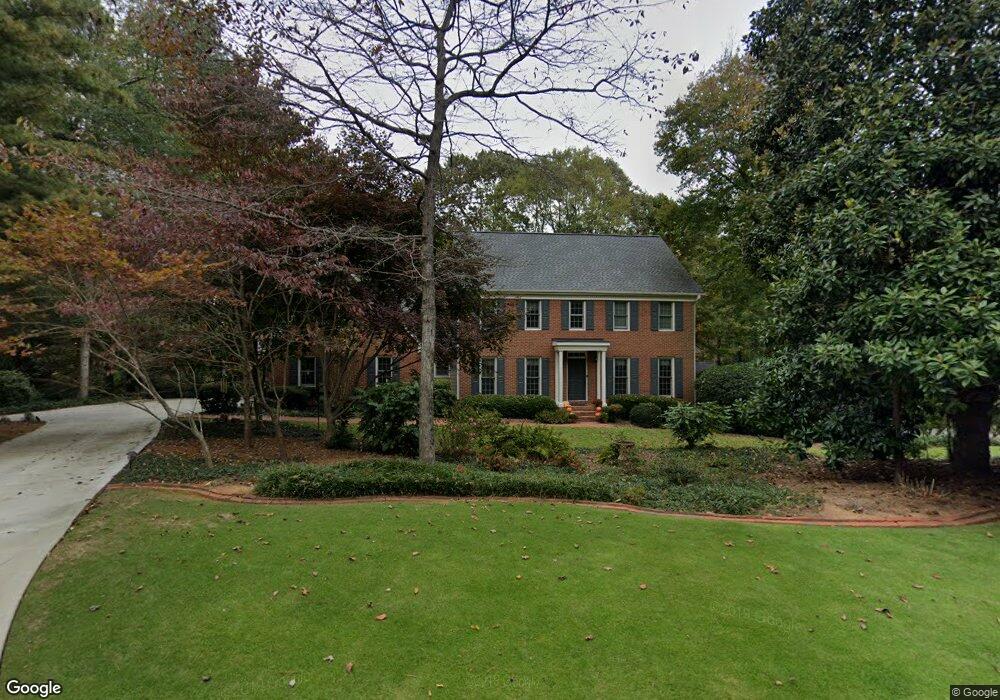
2825 Laurel Green Ct Unit 7 Roswell, GA 30076
Willow Springs NeighborhoodEstimated Value: $812,253 - $975,000
3
Beds
4
Baths
2,891
Sq Ft
$308/Sq Ft
Est. Value
About This Home
This home is located at 2825 Laurel Green Ct Unit 7, Roswell, GA 30076 and is currently estimated at $890,418, approximately $307 per square foot. 2825 Laurel Green Ct Unit 7 is a home located in Fulton County with nearby schools including Northwood Elementary School, Haynes Bridge Middle School, and Centennial High School.
Ownership History
Date
Name
Owned For
Owner Type
Purchase Details
Closed on
Jul 1, 2025
Sold by
Cash Robert J
Bought by
Cash Family Living Trust and Cash Margaret Stenger Tr
Current Estimated Value
Purchase Details
Closed on
Nov 20, 2000
Sold by
Jennings Joseph B and Jennings Gloria A
Bought by
Cash Robert J and Cash Margaret S
Home Financials for this Owner
Home Financials are based on the most recent Mortgage that was taken out on this home.
Original Mortgage
$252,700
Interest Rate
7.81%
Mortgage Type
New Conventional
Purchase Details
Closed on
Aug 15, 1996
Sold by
Rosinski William P Mary J
Bought by
Jennings Joseph B
Purchase Details
Closed on
Aug 30, 1993
Sold by
Columbia Janette G
Bought by
Rosinski William P Mary J
Home Financials for this Owner
Home Financials are based on the most recent Mortgage that was taken out on this home.
Original Mortgage
$195,200
Interest Rate
7.22%
Create a Home Valuation Report for This Property
The Home Valuation Report is an in-depth analysis detailing your home's value as well as a comparison with similar homes in the area
Home Values in the Area
Average Home Value in this Area
Purchase History
| Date | Buyer | Sale Price | Title Company |
|---|---|---|---|
| Cash Family Living Trust | -- | -- | |
| Cash Robert J | $330,000 | -- | |
| Jennings Joseph B | $260,000 | -- | |
| Rosinski William P Mary J | $244,000 | -- |
Source: Public Records
Mortgage History
| Date | Status | Borrower | Loan Amount |
|---|---|---|---|
| Previous Owner | Cash Robert J | $252,700 | |
| Previous Owner | Rosinski William P Mary J | $195,200 | |
| Closed | Jennings Joseph B | $0 |
Source: Public Records
Tax History Compared to Growth
Tax History
| Year | Tax Paid | Tax Assessment Tax Assessment Total Assessment is a certain percentage of the fair market value that is determined by local assessors to be the total taxable value of land and additions on the property. | Land | Improvement |
|---|---|---|---|---|
| 2025 | $987 | $255,880 | $77,120 | $178,760 |
| 2023 | $987 | $265,520 | $59,360 | $206,160 |
| 2022 | $4,230 | $232,640 | $46,440 | $186,200 |
| 2021 | $5,022 | $225,840 | $45,080 | $180,760 |
| 2020 | $5,090 | $200,080 | $35,760 | $164,320 |
| 2019 | $821 | $196,560 | $35,120 | $161,440 |
| 2018 | $4,687 | $191,960 | $34,320 | $157,640 |
| 2017 | $4,174 | $157,400 | $38,640 | $118,760 |
| 2016 | $4,131 | $157,400 | $38,640 | $118,760 |
| 2015 | $4,350 | $135,280 | $38,640 | $96,640 |
| 2014 | $3,484 | $126,400 | $36,120 | $90,280 |
Source: Public Records
Map
Nearby Homes
- 3040 Roxburgh Dr
- 3077 Haynes Trail
- 385 Birch Rill Dr
- 10085 Old Woodland Entry
- 10421 Park Walk Point
- 10280 Crescent Ridge Dr
- 305 Birch Rill Dr
- 225 Wentworth Terrace
- 130 Forrest View Terrace
- 2642 Long Pointe
- 440 Guildhall Grove Unit 2
- 10505 Ash Rill Dr
- 710 Leeds Garden Terrace
- 530 Kearny St
- 10530 Haynes Forest Dr
- 140 Old Sandhurst Landing
- 2835 Laurel Green Ct Unit 7
- 2864 Laurel Green Ct
- 10145 Crescent Hill Ln
- 10155 Crescent Hill Ln
- 10170 Cresent Hill Ln
- 10155 Cresent Hill Ln
- 2840 Laurel Green Ct
- 2845 Laurel Green Ct Unit 7
- 0 Crescent Hill Ln Unit 7255567
- 0 Crescent Hill Ln Unit 8683115
- 0 Crescent Hill Ln Unit 8598746
- 0 Crescent Hill Ln Unit 7141721
- 10145 Cresent Hill Ln
- 2846 Laurel Green Ct
- 10165 Cresent Hill Ln
- 2830 Laurel Green Ct Unit 7
- 0 Laurel Green Ct
- 10175 Cresent Hill Ln
- 2850 Laurel Green Ct
- 2820 Laurel Green Ct