Estimated Value: $292,000 - $421,000
3
Beds
3
Baths
1,546
Sq Ft
$234/Sq Ft
Est. Value
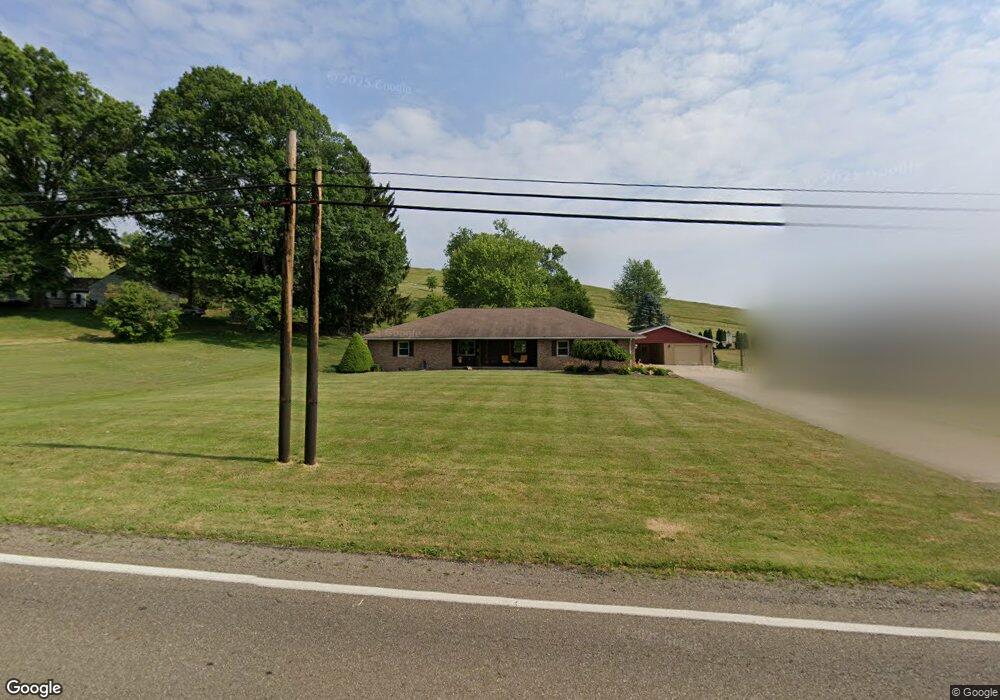
About This Home
This home is located at 2825 State Route 516 NW, Dover, OH 44622 and is currently estimated at $362,429, approximately $234 per square foot. 2825 State Route 516 NW is a home located in Tuscarawas County with nearby schools including Dover High School.
Ownership History
Date
Name
Owned For
Owner Type
Purchase Details
Closed on
Mar 10, 2008
Sold by
Stahl John B and Stahl Barbara W
Bought by
Wineman Randall S and Wineman Sally K
Current Estimated Value
Home Financials for this Owner
Home Financials are based on the most recent Mortgage that was taken out on this home.
Original Mortgage
$176,000
Interest Rate
5.51%
Mortgage Type
Purchase Money Mortgage
Purchase Details
Closed on
Jun 3, 2005
Sold by
Kaser Eugene A
Bought by
Stahl John B and Stahl Barbara W
Home Financials for this Owner
Home Financials are based on the most recent Mortgage that was taken out on this home.
Original Mortgage
$152,000
Interest Rate
4.87%
Mortgage Type
Fannie Mae Freddie Mac
Purchase Details
Closed on
Aug 11, 1989
Sold by
Daniels Bruce
Bought by
Wineman Randall S and Wineman Sally K
Purchase Details
Closed on
Jul 11, 1988
Sold by
Gladys Kenneth E and Swihart Gladys
Bought by
Wineman Randall S and Wineman Sally K
Create a Home Valuation Report for This Property
The Home Valuation Report is an in-depth analysis detailing your home's value as well as a comparison with similar homes in the area
Home Values in the Area
Average Home Value in this Area
Purchase History
| Date | Buyer | Sale Price | Title Company |
|---|---|---|---|
| Wineman Randall S | $220,000 | American Title | |
| Stahl John B | $380,000 | Tusc Title | |
| Wineman Randall S | $127,500 | -- | |
| Wineman Randall S | $15,000 | -- |
Source: Public Records
Mortgage History
| Date | Status | Borrower | Loan Amount |
|---|---|---|---|
| Previous Owner | Wineman Randall S | $176,000 | |
| Previous Owner | Stahl John B | $152,000 | |
| Closed | Stahl John B | $38,000 |
Source: Public Records
Tax History
| Year | Tax Paid | Tax Assessment Tax Assessment Total Assessment is a certain percentage of the fair market value that is determined by local assessors to be the total taxable value of land and additions on the property. | Land | Improvement |
|---|---|---|---|---|
| 2024 | $4,139 | $101,900 | $13,450 | $88,450 |
| 2023 | $4,139 | $291,140 | $38,420 | $252,720 |
| 2022 | $4,181 | $101,899 | $13,447 | $88,452 |
| 2021 | $3,800 | $87,326 | $12,947 | $74,379 |
| 2020 | $3,800 | $87,326 | $12,947 | $74,379 |
| 2019 | $3,830 | $87,326 | $12,947 | $74,379 |
| 2018 | $3,401 | $73,700 | $10,930 | $62,770 |
| 2017 | $3,401 | $73,700 | $10,930 | $62,770 |
| 2016 | $3,407 | $73,700 | $10,930 | $62,770 |
| 2014 | $3,075 | $67,930 | $9,410 | $58,520 |
| 2013 | $3,073 | $67,930 | $9,410 | $58,520 |
Source: Public Records
Map
Nearby Homes
- 3156 Josephine St NW
- 3135 Circleview Dr NW
- 0 Swonger Rd Unit 5161457
- 0 Swonger Rd Unit 5161456
- 1220 Chestnut St
- 0 Ohio Ave Unit 5188259
- 107 W 21st St
- 3030 N Wooster Ave
- 4022 State Route 516 NW
- 0 W Ohio Ave
- 4029 Minard Rd NW
- 1202 N Wooster Ave
- 201 E 12th St
- 1613 N Cross St
- 2815 Race St
- 715 N Walnut St
- 1814 Saltwell Rd NW
- 213 E 27th St
- 401 E 18th St
- 334 W 4th St
- 2805 State Route 516 NW
- 2857 State Route 516 NW
- 2777 State Route 516 NW
- 2885 State Route 516 NW
- 2755 Ohio 516
- 0 Bair Rd Unit 3991893
- 0 Bair Rd Unit 3991880
- 0 Bair Rd Unit 3991900
- 0 Bair Rd Unit 3991879
- 2925 State Route 516 NW
- 2945 Ohio 516
- 2945 State Route 516 NW
- 3468 Bair Rd NW
- 2755 State Route 516 NW
- 2672 State Route 516 NW
- 2973 State Route 516 NW
- 2973 Ohio 516
- 2969 State Route 516 NW
- 2982 State Route 516 NW
- 2987 State Route 516 NW
Your Personal Tour Guide
Ask me questions while you tour the home.