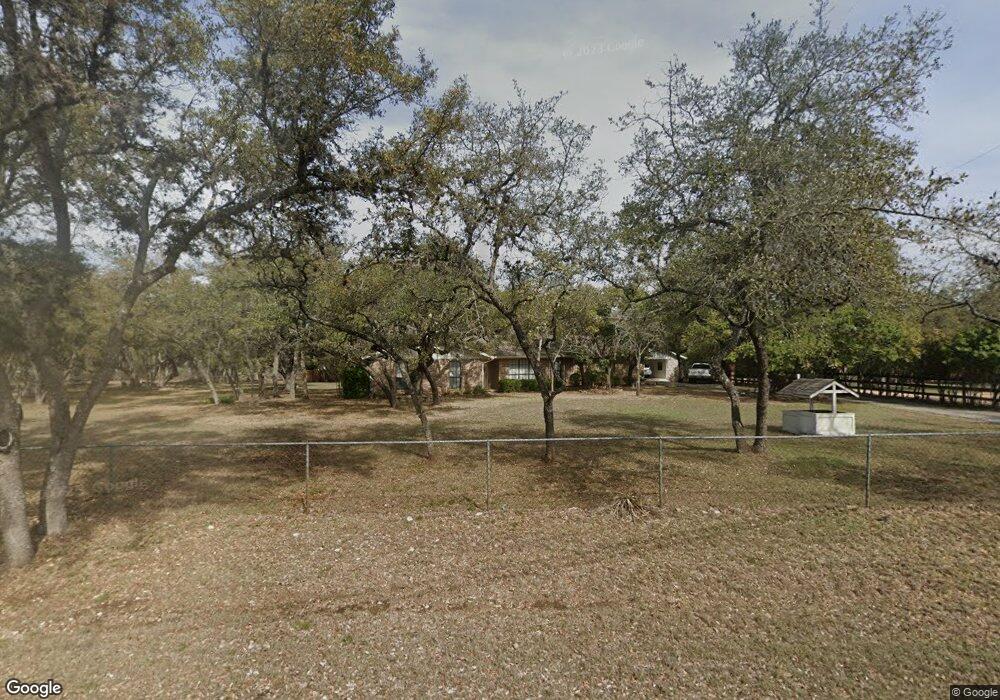
28250 Dos Cerros Loop E Boerne, TX 78006
Scenic Oaks NeighborhoodEstimated Value: $544,267 - $621,000
3
Beds
3
Baths
2,620
Sq Ft
$220/Sq Ft
Est. Value
About This Home
This home is located at 28250 Dos Cerros Loop E, Boerne, TX 78006 and is currently estimated at $577,067, approximately $220 per square foot. 28250 Dos Cerros Loop E is a home located in Bexar County with nearby schools including Kendall Elementary School, Boerne Middle School South, and Samuel V. Champion High School.
Ownership History
Date
Name
Owned For
Owner Type
Purchase Details
Closed on
Jun 28, 2011
Sold by
Moe Duane R
Bought by
Egan Joe B and Monique R Joe B
Current Estimated Value
Home Financials for this Owner
Home Financials are based on the most recent Mortgage that was taken out on this home.
Original Mortgage
$210,000
Outstanding Balance
$144,746
Interest Rate
4.55%
Mortgage Type
New Conventional
Estimated Equity
$432,321
Purchase Details
Closed on
May 25, 2006
Sold by
Howard James B and Howard Lula C
Bought by
Moe Duane R
Home Financials for this Owner
Home Financials are based on the most recent Mortgage that was taken out on this home.
Original Mortgage
$212,000
Interest Rate
6.5%
Mortgage Type
Fannie Mae Freddie Mac
Purchase Details
Closed on
Sep 26, 2000
Sold by
Boyers John M and Boyers Patricia L
Bought by
Howard James B and Howard Lula
Home Financials for this Owner
Home Financials are based on the most recent Mortgage that was taken out on this home.
Original Mortgage
$86,500
Interest Rate
7.97%
Create a Home Valuation Report for This Property
The Home Valuation Report is an in-depth analysis detailing your home's value as well as a comparison with similar homes in the area
Home Values in the Area
Average Home Value in this Area
Purchase History
| Date | Buyer | Sale Price | Title Company |
|---|---|---|---|
| Egan Joe B | -- | Ttt | |
| Moe Duane R | -- | Ameripoint Title San Antonio | |
| Howard James B | -- | Ticor Title Agency |
Source: Public Records
Mortgage History
| Date | Status | Borrower | Loan Amount |
|---|---|---|---|
| Open | Egan Joe B | $210,000 | |
| Previous Owner | Moe Duane R | $212,000 | |
| Previous Owner | Howard James B | $86,500 |
Source: Public Records
Tax History
| Year | Tax Paid | Tax Assessment Tax Assessment Total Assessment is a certain percentage of the fair market value that is determined by local assessors to be the total taxable value of land and additions on the property. | Land | Improvement |
|---|---|---|---|---|
| 2025 | $4,502 | $495,000 | $173,810 | $321,190 |
| 2024 | $4,502 | $520,000 | $173,810 | $346,190 |
| 2023 | $4,502 | $475,845 | $173,810 | $392,940 |
| 2022 | $8,651 | $432,586 | $144,840 | $377,810 |
| 2021 | $7,878 | $393,260 | $115,380 | $277,880 |
| 2020 | $7,568 | $363,300 | $106,050 | $257,250 |
| 2019 | $7,148 | $331,640 | $106,050 | $225,590 |
| 2018 | $7,240 | $335,870 | $106,050 | $229,820 |
| 2017 | $6,757 | $318,065 | $63,120 | $267,800 |
| 2016 | $6,143 | $289,150 | $63,120 | $226,030 |
| 2015 | $5,182 | $277,156 | $63,120 | $220,320 |
| 2014 | $5,182 | $251,960 | $0 | $0 |
Source: Public Records
Map
Nearby Homes
- 9803 Saxet Dr
- 28515 Saxet Dr
- 9833 Saxet Dr
- 9845 Dos Cerros Loop E
- 10016 Rebecca Place
- 9904 Deidehban Dr
- 28710 Benedikt Path
- 10037 Rebecca Place
- 9627 Boerne Haze
- 9706 Kremmen Place
- 28035 Axis Dr
- 9767 Kremmen Place
- 9700 Innes Place
- 10156 Axis Cir
- 28827 Becker Crossing
- 28535 Waterview Dr
- 10281 Headwind
- 28839 Porch Swing
- 9750 Monken
- 9743 Monken
- 28248 Dos Cerros Loop E
- 28244 Dos Cerros Loop E
- 28261 Dos Cerros Loop E
- 28249 Dos Cerros Loop E
- 9707 Saxet Dr
- 9760 Deer Ridge Dr
- 28236 Dos Cerros Loop E
- 28237 Dos Cerros Loop E
- 28237 Dos Cerros Loop E Unit BACK HOUSE
- 28237 Dos Cerros Loop E Unit GUEST HOME
- 28412 Saxet Dr
- 28228 Dos Cerros Loop E
- 9635 Windwood Dr
- 28413 Saxet Dr
- 28225 Dos Cerros Loop E
- 9643 Windwood Dr
- 9816 Saxet Dr
- 9623 Windwood Dr
- 9815 Saxet Dr
- 28421 Saxet Dr
Your Personal Tour Guide
Ask me questions while you tour the home.