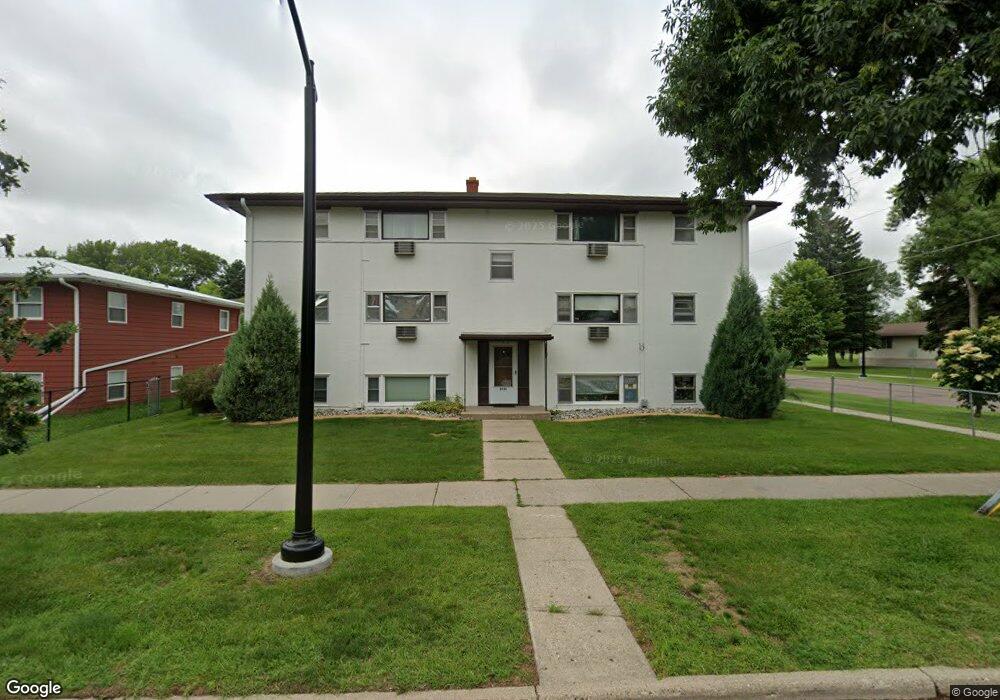
2826 8th St N Unit 1 Fargo, ND 58102
Northport NeighborhoodEstimated Value: $101,000 - $132,533
2
Beds
1
Bath
864
Sq Ft
$142/Sq Ft
Est. Value
About This Home
This home is located at 2826 8th St N Unit 1, Fargo, ND 58102 and is currently estimated at $122,383, approximately $141 per square foot. 2826 8th St N Unit 1 is a home located in Cass County with nearby schools including McKinley Elementary School, Ben Franklin Middle School, and North High School.
Ownership History
Date
Name
Owned For
Owner Type
Purchase Details
Closed on
Mar 15, 2021
Sold by
Hanson Mitchell and Hanson Susan
Bought by
Gotta Joseph C
Current Estimated Value
Home Financials for this Owner
Home Financials are based on the most recent Mortgage that was taken out on this home.
Original Mortgage
$84,000
Outstanding Balance
$62,262
Interest Rate
2.7%
Mortgage Type
New Conventional
Estimated Equity
$60,121
Purchase Details
Closed on
Mar 21, 2016
Sold by
Jones Larry and Alberg Jones Sherri Ann
Bought by
Hanson Michell
Home Financials for this Owner
Home Financials are based on the most recent Mortgage that was taken out on this home.
Original Mortgage
$47,200
Interest Rate
3.62%
Mortgage Type
Future Advance Clause Open End Mortgage
Purchase Details
Closed on
Sep 18, 2015
Sold by
Jones Larry and Estate Of Magdelena A Jones
Bought by
Jones Larry
Create a Home Valuation Report for This Property
The Home Valuation Report is an in-depth analysis detailing your home's value as well as a comparison with similar homes in the area
Home Values in the Area
Average Home Value in this Area
Purchase History
| Date | Buyer | Sale Price | Title Company |
|---|---|---|---|
| Gotta Joseph C | $105,000 | The Title Co | |
| Hanson Michell | $52,000 | Title Co | |
| Jones Larry | -- | None Available |
Source: Public Records
Mortgage History
| Date | Status | Borrower | Loan Amount |
|---|---|---|---|
| Open | Gotta Joseph C | $84,000 | |
| Previous Owner | Hanson Michell | $47,200 |
Source: Public Records
Tax History Compared to Growth
Tax History
| Year | Tax Paid | Tax Assessment Tax Assessment Total Assessment is a certain percentage of the fair market value that is determined by local assessors to be the total taxable value of land and additions on the property. | Land | Improvement |
|---|---|---|---|---|
| 2024 | $913 | $49,200 | $3,350 | $45,850 |
| 2023 | $1,406 | $49,200 | $3,350 | $45,850 |
| 2022 | $1,388 | $47,750 | $3,350 | $44,400 |
| 2021 | $1,199 | $41,550 | $3,350 | $38,200 |
| 2020 | $1,184 | $41,550 | $3,350 | $38,200 |
| 2019 | $1,125 | $41,550 | $1,850 | $39,700 |
| 2018 | $1,038 | $38,750 | $1,850 | $36,900 |
| 2017 | $998 | $37,600 | $1,850 | $35,750 |
| 2016 | $822 | $34,200 | $1,850 | $32,350 |
| 2015 | $934 | $34,200 | $1,400 | $32,800 |
| 2014 | $736 | $25,650 | $1,400 | $24,250 |
| 2013 | $58 | $25,650 | $1,400 | $24,250 |
Source: Public Records
Map
Nearby Homes
- 501 Forest Ave N Unit C
- 2510 10th St N
- 418 25th Ave N
- 310 27th Ave N
- 2902 3rd St N
- 3113 8th St N
- 2214 9 1 2 St N
- 2807 Edgewood Dr N
- 3129 8th St N
- 801 32nd Ave N Unit A102
- 2512 2nd St N
- 2926 Edgewood Dr N
- 207 23rd Ave N
- 1914 9th St N
- 101 27th Ave N
- 2925 Edgewood Dr N
- 87 28th Ave N
- 2937 Edgewood Dr N
- 3217 Cherry Ln N
- 305 19th Ave N
- 2826 8th St N Unit 5
- 2826 8th St N Unit 6
- 2826 8th St N Unit 4
- 2826 8th St N Unit 3
- 2826 8th St N Unit 2
- 2826 8th St N Unit 1
- 2826 8th St N
- 2822 8th St N
- 2829 9th St N
- 2829 9th St N
- 2818 8th St N
- 2825 9th St N
- 2825 9th St N
- 2821 9th St N
- 2821 9th St N
- 2814 8th St N
- 2807 9th St N Unit A4
- 2807 9th St N Unit A3
- 2807 9th St N Unit A2
- 2807 9th St N Unit A1