Estimated Value: $222,552 - $239,000
5
Beds
3
Baths
1,701
Sq Ft
$134/Sq Ft
Est. Value
About This Home
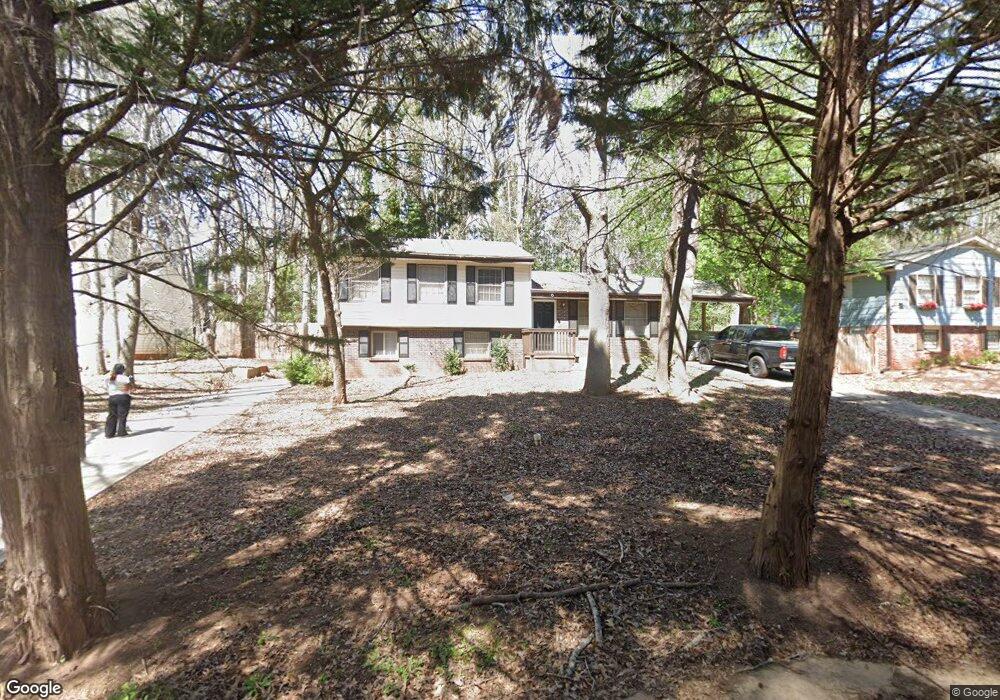
This home is located at 2826 Bretton Dr, Rex, GA 30273 and is currently estimated at $227,888, approximately $133 per square foot. 2826 Bretton Dr is a home located in Clayton County with nearby schools including William M. Mcgarrah Elementary School, Rex Mill Middle School, and Mount Zion High School.
Ownership History
Date
Name
Owned For
Owner Type
Purchase Details
Closed on
May 18, 2021
Sold by
Baf 1 Llc
Bought by
Baf Assets 3 Llc
Current Estimated Value
Purchase Details
Closed on
Jan 30, 2020
Sold by
Valor Homes 505 Llc
Bought by
Baf 1 Llc
Purchase Details
Closed on
Sep 14, 2009
Sold by
Alaimo Anthony
Bought by
Valor Homes 505 Llc
Purchase Details
Closed on
Jul 22, 2009
Sold by
Georgia Hsng & Finance Authori
Bought by
Alaimo Anthony
Purchase Details
Closed on
Sep 7, 2005
Sold by
Hamilton Raymond S and Hamilton Theresa
Bought by
Georgia Housing & Fin Auth
Purchase Details
Closed on
May 7, 1997
Sold by
Carmical Miriam M
Bought by
Hamilton Raymond S and Hamilton Theresa M
Home Financials for this Owner
Home Financials are based on the most recent Mortgage that was taken out on this home.
Original Mortgage
$63,466
Interest Rate
8.18%
Mortgage Type
FHA
Create a Home Valuation Report for This Property
The Home Valuation Report is an in-depth analysis detailing your home's value as well as a comparison with similar homes in the area
Home Values in the Area
Average Home Value in this Area
Purchase History
| Date | Buyer | Sale Price | Title Company |
|---|---|---|---|
| Baf Assets 3 Llc | $6,078,000 | -- | |
| Baf 1 Llc | $128,770 | -- | |
| Valor Homes 505 Llc | -- | -- | |
| Alaimo Anthony | $20,000 | -- | |
| Georgia Housing & Fin Auth | $86,769 | -- | |
| Hamilton Raymond S | $85,400 | -- |
Source: Public Records
Mortgage History
| Date | Status | Borrower | Loan Amount |
|---|---|---|---|
| Previous Owner | Hamilton Raymond S | $63,466 |
Source: Public Records
Tax History Compared to Growth
Tax History
| Year | Tax Paid | Tax Assessment Tax Assessment Total Assessment is a certain percentage of the fair market value that is determined by local assessors to be the total taxable value of land and additions on the property. | Land | Improvement |
|---|---|---|---|---|
| 2024 | $2,996 | $79,280 | $7,200 | $72,080 |
| 2023 | $1,632 | $45,200 | $7,200 | $38,000 |
| 2022 | $1,774 | $45,200 | $7,200 | $38,000 |
| 2021 | $1,327 | $46,040 | $7,200 | $38,840 |
| 2020 | $1,344 | $33,600 | $5,600 | $28,000 |
| 2019 | $1,364 | $33,897 | $5,600 | $28,297 |
| 2018 | $846 | $20,850 | $5,600 | $15,250 |
| 2017 | $848 | $20,850 | $5,600 | $15,250 |
| 2016 | $848 | $23,161 | $5,600 | $17,561 |
| 2015 | $630 | $0 | $0 | $0 |
| 2014 | $626 | $15,746 | $6,400 | $9,346 |
Source: Public Records
Map
Nearby Homes
- 2845 Heritage Ln
- 2881 Panther Ct
- 2933 Bretton Dr
- 2783 Mill Lake Way
- 6486 Aquila Dr
- 2688 Heritage Ln
- 2705 Heritage Ln
- 2681 Heritage Ln
- 6485 Bobolink Ct
- 6844 Silver Maple Dr
- 6848 Silver Maple Dr
- 6852 Silver Maple Dr
- 6584 Sleepy Hollow Ln
- 2613 Stratford Ln Unit 3
- 2617 Terrace Pkwy
- 6397 E Meyer Dr
- 6697 Cambridge Dr
- 6498 Carolyn Ct
- 2834 Bretton Dr Unit /2
- 2834 Bretton Dr
- 2818 Bretton Dr Unit 46
- 2818 Bretton Dr Unit 4
- 2812 Bretton Dr
- 6629 Bretton Ct
- 2844 Bretton Dr
- 2844 Bretton Dr Unit 3
- 2844 Bretton Dr Unit D
- 0 Bretton Ct Unit 8337870
- 0 Bretton Ct Unit 7256864
- 0 Bretton Ct Unit 8763119
- 0 Bretton Ct
- 6583 Aquila Dr
- 2817 Bretton Dr
- 6639 Bretton Ct
- 2813 Bretton Dr Unit 4
- 2809 Bretton Dr
- 2854 Bretton Dr
- 6630 Bretton Ct