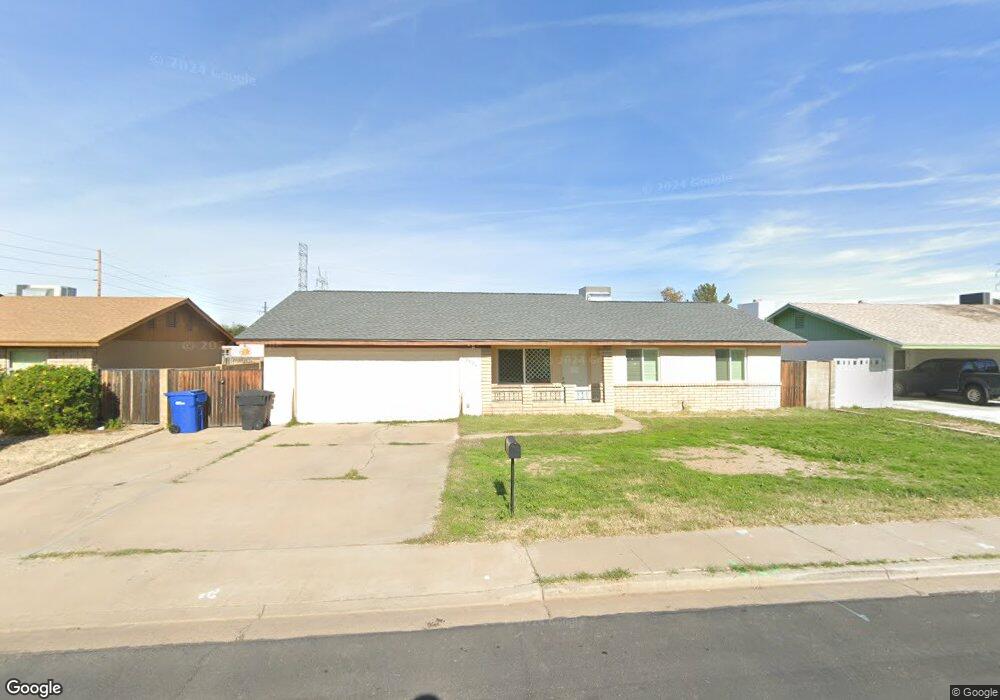
2826 E Caballero St Mesa, AZ 85213
The Groves NeighborhoodEstimated Value: $345,737 - $391,000
Studio
2
Baths
1,323
Sq Ft
$281/Sq Ft
Est. Value
About This Home
This home is located at 2826 E Caballero St, Mesa, AZ 85213 and is currently estimated at $371,934, approximately $281 per square foot. 2826 E Caballero St is a home located in Maricopa County with nearby schools including Highland Elementary School, Franklin at Brimhall Elementary School, and Franklin West Elementary School.
Ownership History
Date
Name
Owned For
Owner Type
Purchase Details
Closed on
Dec 29, 1999
Sold by
Boyles Timothy M
Bought by
Novaco Mariellen
Current Estimated Value
Home Financials for this Owner
Home Financials are based on the most recent Mortgage that was taken out on this home.
Original Mortgage
$118,817
Outstanding Balance
$37,297
Interest Rate
7.68%
Mortgage Type
FHA
Estimated Equity
$334,637
Purchase Details
Closed on
Jul 13, 1998
Sold by
Barbano Michael J
Bought by
Boyles Timothy M
Home Financials for this Owner
Home Financials are based on the most recent Mortgage that was taken out on this home.
Original Mortgage
$107,100
Interest Rate
7%
Mortgage Type
VA
Purchase Details
Closed on
Apr 2, 1998
Sold by
Barbano Peggy D
Bought by
Barbano Michael J
Home Financials for this Owner
Home Financials are based on the most recent Mortgage that was taken out on this home.
Original Mortgage
$78,991
Interest Rate
7.18%
Create a Home Valuation Report for This Property
The Home Valuation Report is an in-depth analysis detailing your home's value as well as a comparison with similar homes in the area
Home Values in the Area
Average Home Value in this Area
Purchase History
| Date | Buyer | Sale Price | Title Company |
|---|---|---|---|
| Novaco Mariellen | $119,000 | Stewart Title & Trust | |
| Boyles Timothy M | $105,000 | Capital Title Agency | |
| Barbano Michael J | -- | Chicago Title Insurance Co |
Source: Public Records
Mortgage History
| Date | Status | Borrower | Loan Amount |
|---|---|---|---|
| Open | Novaco Mariellen | $118,817 | |
| Previous Owner | Boyles Timothy M | $107,100 | |
| Previous Owner | Barbano Michael J | $78,991 |
Source: Public Records
Tax History
| Year | Tax Paid | Tax Assessment Tax Assessment Total Assessment is a certain percentage of the fair market value that is determined by local assessors to be the total taxable value of land and additions on the property. | Land | Improvement |
|---|---|---|---|---|
| 2025 | $1,133 | $13,640 | -- | -- |
| 2024 | $1,145 | $12,991 | -- | -- |
| 2023 | $1,145 | $28,530 | $5,700 | $22,830 |
| 2022 | $1,120 | $21,910 | $4,380 | $17,530 |
| 2021 | $1,151 | $20,820 | $4,160 | $16,660 |
| 2020 | $1,135 | $18,430 | $3,680 | $14,750 |
| 2019 | $1,052 | $16,370 | $3,270 | $13,100 |
| 2018 | $1,004 | $15,020 | $3,000 | $12,020 |
| 2017 | $973 | $13,710 | $2,740 | $10,970 |
| 2016 | $955 | $12,920 | $2,580 | $10,340 |
| 2015 | $902 | $11,810 | $2,360 | $9,450 |
Source: Public Records
Map
Nearby Homes
- 3050 E Cicero St
- 3020 E Main St Unit G97
- 3020 E Main St Unit I-52
- 3020 E Main St Unit T82
- 824 N York Cir
- 432 N Whiting
- 303 N Lindsay Rd Unit O-8
- 303 N Lindsay Rd Unit W-13
- 303 N Lindsay Rd Unit I95
- 303 N Lindsay Rd Unit I-102
- 303 N Lindsay Rd Unit W-4
- 303 N Lindsay Rd Unit W15
- 2458 E University Dr Unit 2
- 721 N 25th St
- 3228 E Dover St
- 2416 E University Dr Unit 4
- 2655 E Encanto St
- 2419 E Billings St
- 2435 E Evergreen St
- 3203 E Ellis St
- 2818 E Caballero St
- 2830 E Caballero St
- 2825 E Contessa St
- 2817 E Contessa St
- 2831 E Contessa St
- 2836 E Caballero St
- 2808 E Caballero St
- 2823 E Caballero St
- 2829 E Caballero St
- 2815 E Caballero St
- 2839 E Contessa St
- 2837 E Caballero St
- 2807 E Caballero St
- 2844 E Caballero St
- 2845 E Contessa St
- 2824 E Contessa St
- 2816 E Contessa St
- 2832 E Contessa St
- 2847 E Caballero St
- 2810 E Contessa St
Your Personal Tour Guide
Ask me questions while you tour the home.