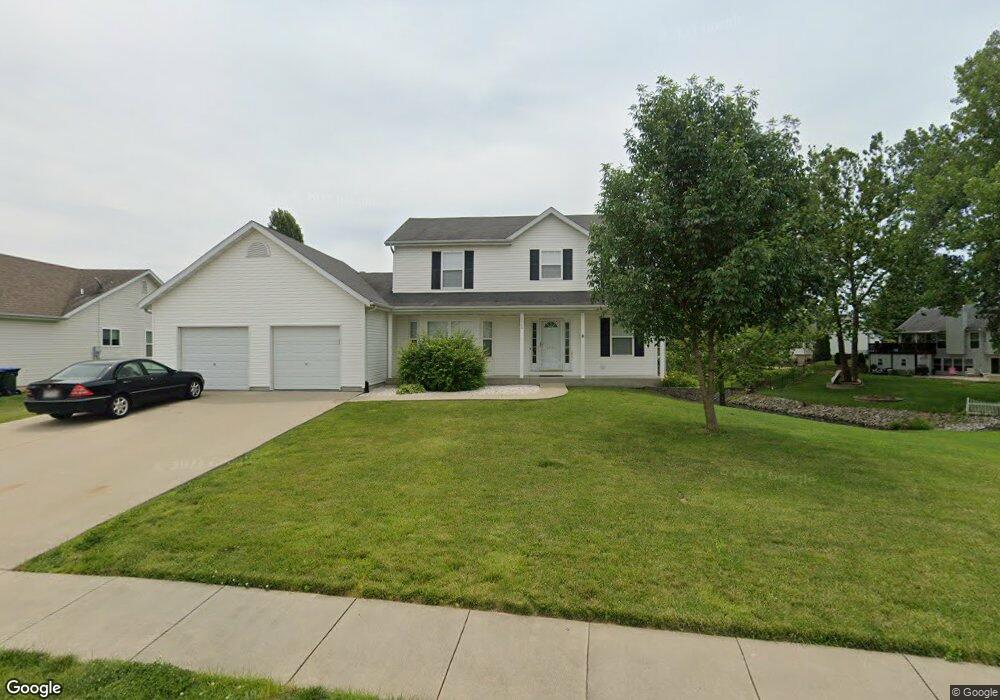
2826 Robert Dr Columbia, IL 62236
Estimated Value: $277,755 - $380,000
3
Beds
--
Bath
950
Sq Ft
$330/Sq Ft
Est. Value
About This Home
This home is located at 2826 Robert Dr, Columbia, IL 62236 and is currently estimated at $313,939, approximately $330 per square foot. 2826 Robert Dr is a home located in Monroe County with nearby schools including Columbia Middle School and Columbia High School.
Ownership History
Date
Name
Owned For
Owner Type
Purchase Details
Closed on
Nov 25, 2019
Sold by
Waterloo Five Llc
Bought by
Holston Christopher
Current Estimated Value
Home Financials for this Owner
Home Financials are based on the most recent Mortgage that was taken out on this home.
Original Mortgage
$190,400
Outstanding Balance
$168,356
Interest Rate
3.75%
Mortgage Type
New Conventional
Estimated Equity
$145,583
Purchase Details
Closed on
Nov 22, 2019
Sold by
Waterloo Five Llc
Bought by
Holston Christopher
Home Financials for this Owner
Home Financials are based on the most recent Mortgage that was taken out on this home.
Original Mortgage
$190,400
Outstanding Balance
$168,356
Interest Rate
3.75%
Mortgage Type
New Conventional
Estimated Equity
$145,583
Purchase Details
Closed on
Oct 22, 2018
Sold by
Judicial Sales Corporation
Bought by
Waterloo Five Llc
Purchase Details
Closed on
Oct 19, 2018
Sold by
Judicial Sales Corporation
Bought by
Waterloo Five Llc
Create a Home Valuation Report for This Property
The Home Valuation Report is an in-depth analysis detailing your home's value as well as a comparison with similar homes in the area
Home Values in the Area
Average Home Value in this Area
Purchase History
| Date | Buyer | Sale Price | Title Company |
|---|---|---|---|
| Holston Christopher | $238,000 | Monroe County Title Company | |
| Holston Christopher | $238,000 | Monroe County Title Company | |
| Waterloo Five Llc | $176,000 | -- | |
| Waterloo Five Llc | $176,000 | -- |
Source: Public Records
Mortgage History
| Date | Status | Borrower | Loan Amount |
|---|---|---|---|
| Open | Holston Christopher | $190,400 | |
| Closed | Holston Christopher | $190,400 |
Source: Public Records
Tax History Compared to Growth
Tax History
| Year | Tax Paid | Tax Assessment Tax Assessment Total Assessment is a certain percentage of the fair market value that is determined by local assessors to be the total taxable value of land and additions on the property. | Land | Improvement |
|---|---|---|---|---|
| 2024 | $3,198 | $61,961 | $14,352 | $47,609 |
| 2023 | $3,233 | $58,670 | $13,590 | $45,080 |
| 2022 | $3,276 | $58,670 | $13,590 | $45,080 |
| 2021 | $3,249 | $58,670 | $13,590 | $45,080 |
| 2020 | $3,667 | $58,670 | $13,590 | $45,080 |
| 2019 | $4,052 | $58,670 | $13,590 | $45,080 |
| 2018 | $3,812 | $58,670 | $13,590 | $45,080 |
| 2017 | $4,678 | $72,625 | $13,835 | $58,790 |
| 2016 | $0 | $68,830 | $13,170 | $55,660 |
| 2015 | $4,490 | $68,440 | $14,270 | $54,170 |
| 2014 | $4,090 | $63,700 | $14,270 | $49,430 |
| 2012 | -- | $64,890 | $14,000 | $50,890 |
Source: Public Records
Map
Nearby Homes
- 2838 Robert Dr
- 2846 Robert Dr
- 305 Fox Run Dr
- 2620 Brookfield Ct
- 5 Ogle Estates
- 7 Ogle Estates
- 4 Ogle Estates
- 1539 Frost Landing
- 1382 Walnut Ridge Dr
- 1374 Walnut Ridge Dr
- 527 Fairfax Dr
- 816 Briar Lake Place
- 2219 Stone Gate Dr
- 2148 Stone Gate Dr
- 6 Ogle Estates
- 3 Ogle Estates
- 2011 Shady Station Trail
- 1 Ogle Estates
- 1 Meadowridge E
- 209 Heritage St
- 2830 Robert Dr
- 2820 Robert Dr
- 2834 Robert Dr
- 2634 Lakeshore Dr
- 2632 Lakeshore Dr
- 2825 Robert Dr
- 2636 Lakeshore Dr
- 2833 Robert Dr
- 2816 Robert Dr
- 2817 Robert Dr
- 2630 Lakeshore Dr
- 2638 Lakeshore Dr
- 2813 Robert Dr
- 2628 Lakeshore Dr
- 2842 Robert Dr
- 217 Kenrick Dr
- 2812 Robert Dr
- 213 Kenrick Dr
- 207 Kenrick Dr
- 2635 Lakeshore Dr