Estimated Value: $460,000 - $508,000
--
Bed
--
Bath
1,298
Sq Ft
$374/Sq Ft
Est. Value
About This Home
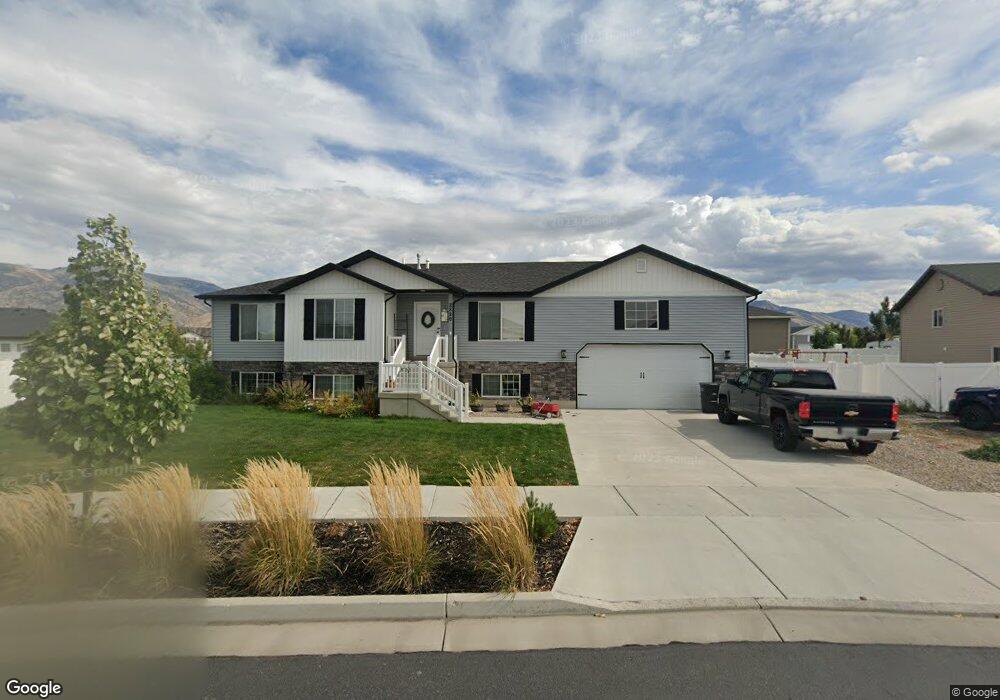
This home is located at 2826 S 1150 W, Logan, UT 84321 and is currently estimated at $484,985, approximately $373 per square foot. 2826 S 1150 W is a home with nearby schools including Nibley School, South Cache Middle School, and Spring Creek Middle School.
Ownership History
Date
Name
Owned For
Owner Type
Purchase Details
Closed on
Apr 24, 2020
Sold by
Chavira Harvey Jaclyn
Bought by
Chavira Harvey Jaclyn and Harvey Cory Dean
Current Estimated Value
Home Financials for this Owner
Home Financials are based on the most recent Mortgage that was taken out on this home.
Original Mortgage
$228,800
Outstanding Balance
$203,018
Interest Rate
3.6%
Mortgage Type
New Conventional
Estimated Equity
$281,967
Purchase Details
Closed on
Nov 9, 2015
Sold by
Neighborhood Nonprofit Housing Corporati
Bought by
Chavira Harvey Jaclyn
Home Financials for this Owner
Home Financials are based on the most recent Mortgage that was taken out on this home.
Original Mortgage
$189,866
Interest Rate
3.8%
Mortgage Type
USDA
Create a Home Valuation Report for This Property
The Home Valuation Report is an in-depth analysis detailing your home's value as well as a comparison with similar homes in the area
Home Values in the Area
Average Home Value in this Area
Purchase History
| Date | Buyer | Sale Price | Title Company |
|---|---|---|---|
| Chavira Harvey Jaclyn | -- | Cache Title Logan | |
| Chavira Harvey Jaclyn | -- | Cache Title Logan |
Source: Public Records
Mortgage History
| Date | Status | Borrower | Loan Amount |
|---|---|---|---|
| Open | Chavira Harvey Jaclyn | $228,800 | |
| Closed | Chavira Harvey Jaclyn | $189,866 |
Source: Public Records
Tax History Compared to Growth
Tax History
| Year | Tax Paid | Tax Assessment Tax Assessment Total Assessment is a certain percentage of the fair market value that is determined by local assessors to be the total taxable value of land and additions on the property. | Land | Improvement |
|---|---|---|---|---|
| 2024 | $2,348 | $292,225 | $0 | $0 |
| 2023 | $2,461 | $286,825 | $0 | $0 |
| 2022 | $2,562 | $286,825 | $0 | $0 |
| 2021 | $1,678 | $291,797 | $65,000 | $226,797 |
| 2020 | $1,584 | $262,215 | $65,000 | $197,215 |
| 2019 | $1,662 | $262,215 | $65,000 | $197,215 |
| 2018 | $1,494 | $230,085 | $54,000 | $176,085 |
| 2017 | $1,495 | $121,935 | $0 | $0 |
| 2016 | $1,512 | $54,000 | $0 | $0 |
Source: Public Records
Map
Nearby Homes