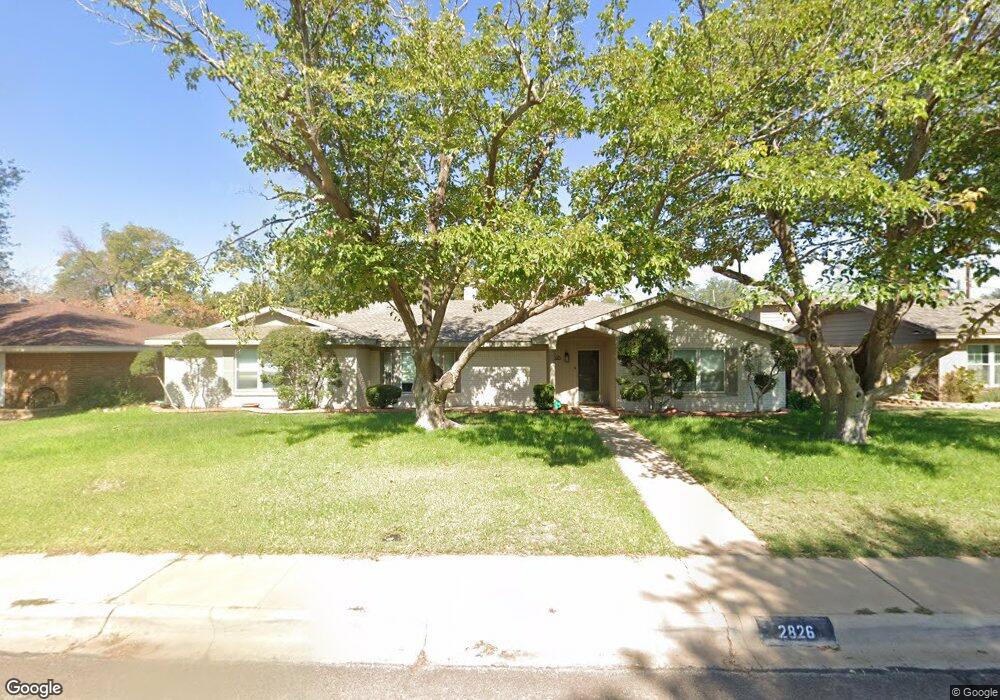
2826 Stutz Dr Midland, TX 79705
Estimated Value: $374,000 - $457,610
4
Beds
4
Baths
2,888
Sq Ft
$148/Sq Ft
Est. Value
About This Home
This home is located at 2826 Stutz Dr, Midland, TX 79705 and is currently estimated at $427,903, approximately $148 per square foot. 2826 Stutz Dr is a home located in Midland County with nearby schools including Midland High School, Robert H. Goddard Junior High School, and Trinity School of Midland.
Ownership History
Date
Name
Owned For
Owner Type
Purchase Details
Closed on
Jan 14, 2022
Sold by
Scott Hawes Laurence
Bought by
Sparks Travis and Sparks Kathleen
Current Estimated Value
Home Financials for this Owner
Home Financials are based on the most recent Mortgage that was taken out on this home.
Original Mortgage
$265,050
Outstanding Balance
$243,580
Interest Rate
3.05%
Mortgage Type
New Conventional
Estimated Equity
$184,323
Purchase Details
Closed on
Jan 11, 2022
Sold by
Scott Hawes Laurence
Bought by
Sparks Travis and Sparks Kathleen
Home Financials for this Owner
Home Financials are based on the most recent Mortgage that was taken out on this home.
Original Mortgage
$265,050
Outstanding Balance
$243,580
Interest Rate
3.05%
Mortgage Type
New Conventional
Estimated Equity
$184,323
Purchase Details
Closed on
Dec 11, 2017
Sold by
Hawes Joyce R
Bought by
Hawes Joyce R
Purchase Details
Closed on
Aug 11, 1975
Bought by
Hawes Joyce R
Create a Home Valuation Report for This Property
The Home Valuation Report is an in-depth analysis detailing your home's value as well as a comparison with similar homes in the area
Home Values in the Area
Average Home Value in this Area
Purchase History
| Date | Buyer | Sale Price | Title Company |
|---|---|---|---|
| Sparks Travis | -- | Corporation Service | |
| Sparks Travis | -- | Corporation Service | |
| Hawes Joyce R | -- | None Available | |
| Hawes Joyce R | -- | -- |
Source: Public Records
Mortgage History
| Date | Status | Borrower | Loan Amount |
|---|---|---|---|
| Open | Sparks Travis | $265,050 | |
| Closed | Sparks Travis | $265,050 |
Source: Public Records
Tax History Compared to Growth
Tax History
| Year | Tax Paid | Tax Assessment Tax Assessment Total Assessment is a certain percentage of the fair market value that is determined by local assessors to be the total taxable value of land and additions on the property. | Land | Improvement |
|---|---|---|---|---|
| 2025 | $6,278 | $405,050 | $31,120 | $373,930 |
| 2024 | $6,286 | $413,960 | $31,120 | $382,840 |
| 2023 | $5,171 | $345,030 | $31,120 | $313,910 |
| 2022 | $5,112 | $327,200 | $31,120 | $296,080 |
| 2021 | $5,529 | $317,380 | $31,120 | $286,260 |
| 2020 | $5,649 | $325,960 | $31,120 | $294,840 |
| 2019 | $6,171 | $325,960 | $31,120 | $294,840 |
| 2018 | $5,742 | $295,300 | $31,120 | $264,180 |
| 2017 | $5,455 | $280,560 | $31,120 | $249,440 |
| 2016 | $5,191 | $274,500 | $31,120 | $243,380 |
| 2015 | -- | $261,340 | $31,120 | $230,220 |
| 2014 | -- | $254,260 | $31,120 | $223,140 |
Source: Public Records
Map
Nearby Homes
- 3203 Maxwell Dr
- 3205 Maxwell Dr
- 2817 Maxwell Dr
- 3207 Marmon Dr
- 3105 Auburn Dr
- 3200 Durant Dr
- 2811 Durant Dr
- 2806 Auburn Dr
- 3200 W Wadley Ave
- 3204 W Wadley Ave
- 4 Amhurst Ct
- 3 Marinor Ct
- 3206 Haynes Dr
- 5 Chatham Ct
- 2613 Haynes Dr
- 3308 Providence Dr
- 3200 Whitney Dr
- 63 Ironwood Ct Unit 91
- 63 Ironwood Ct
- 2400 Metz Ct