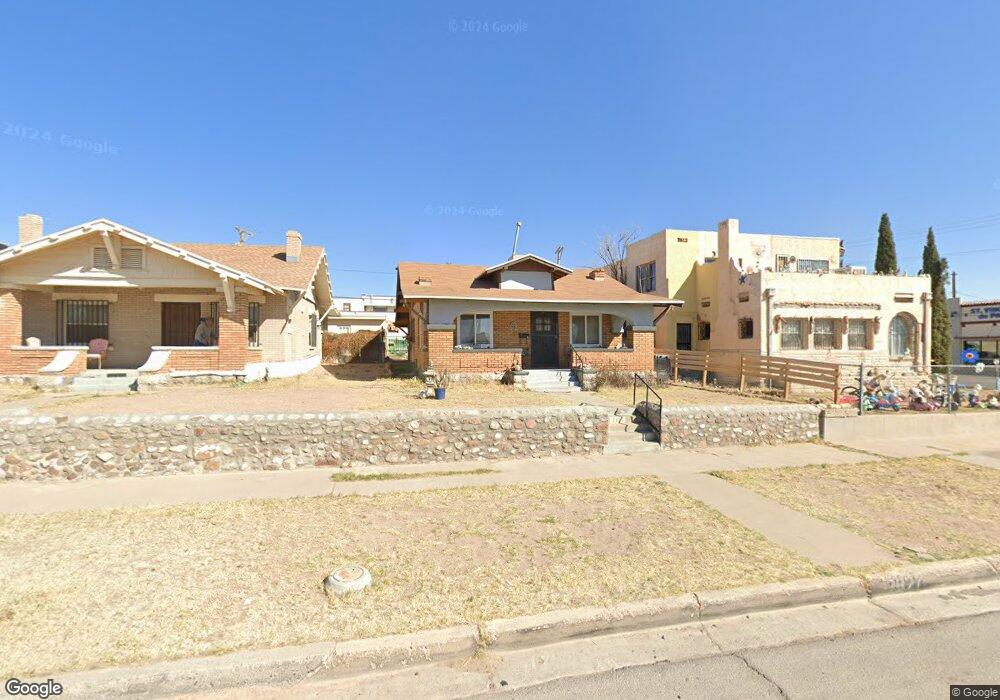
2827 Louisville Ave El Paso, TX 79930
Manhattan Heights NeighborhoodEstimated Value: $159,000 - $218,000
3
Beds
1
Bath
962
Sq Ft
$184/Sq Ft
Est. Value
About This Home
This home is located at 2827 Louisville Ave, El Paso, TX 79930 and is currently estimated at $176,794, approximately $183 per square foot. 2827 Louisville Ave is a home located in El Paso County with nearby schools including Crockett Elementary School, Armendariz Middle School, and Middle School-5 NW Middle.
Ownership History
Date
Name
Owned For
Owner Type
Purchase Details
Closed on
Aug 9, 2017
Sold by
Martinez Moises and Martinez Griselda
Bought by
Flores Emma Linda
Current Estimated Value
Home Financials for this Owner
Home Financials are based on the most recent Mortgage that was taken out on this home.
Original Mortgage
$68,732
Outstanding Balance
$58,530
Interest Rate
4.75%
Mortgage Type
FHA
Estimated Equity
$118,264
Purchase Details
Closed on
Jul 21, 2010
Sold by
Fraire Jesus
Bought by
Fraire Jesus Manuel
Purchase Details
Closed on
Oct 13, 1999
Sold by
Tollen Robert B and Tollen Cynthia D
Bought by
Fraire Jesus and Fraire Maria Luisa
Purchase Details
Closed on
Oct 9, 1997
Sold by
Foret Dora G and Filleman Richard T
Bought by
Tollen Robert B and Tollen Cynthia D
Home Financials for this Owner
Home Financials are based on the most recent Mortgage that was taken out on this home.
Original Mortgage
$35,000
Interest Rate
7.59%
Create a Home Valuation Report for This Property
The Home Valuation Report is an in-depth analysis detailing your home's value as well as a comparison with similar homes in the area
Home Values in the Area
Average Home Value in this Area
Purchase History
| Date | Buyer | Sale Price | Title Company |
|---|---|---|---|
| Flores Emma Linda | -- | None Available | |
| Fraire Jesus Manuel | -- | None Available | |
| Fraire Jesus | -- | -- | |
| Tollen Robert B | -- | -- |
Source: Public Records
Mortgage History
| Date | Status | Borrower | Loan Amount |
|---|---|---|---|
| Open | Flores Emma Linda | $68,732 | |
| Previous Owner | Tollen Robert B | $35,000 |
Source: Public Records
Tax History Compared to Growth
Tax History
| Year | Tax Paid | Tax Assessment Tax Assessment Total Assessment is a certain percentage of the fair market value that is determined by local assessors to be the total taxable value of land and additions on the property. | Land | Improvement |
|---|---|---|---|---|
| 2025 | $808 | $98,964 | -- | -- |
| 2024 | $808 | $89,967 | -- | -- |
| 2023 | $736 | $81,788 | $0 | $0 |
| 2022 | $2,201 | $74,353 | $0 | $0 |
| 2021 | $2,110 | $67,594 | $13,901 | $53,693 |
| 2020 | $1,924 | $62,603 | $12,562 | $50,041 |
| 2018 | $1,841 | $62,192 | $12,562 | $49,630 |
| 2017 | $1,126 | $39,989 | $12,562 | $27,427 |
| 2016 | $1,815 | $64,442 | $12,562 | $51,880 |
| 2015 | $1,234 | $39,989 | $12,562 | $27,427 |
| 2014 | $1,234 | $45,092 | $12,562 | $32,530 |
Source: Public Records
Map
Nearby Homes
- 2735 Aurora Ave
- 2624 Aurora Ave
- 2903 Savannah Ave
- 2630 Wheeling Ave
- 1712 Elm St
- 3009 Savannah Ave
- 1701 Elm St
- 1813 & 181 Alabama St
- 2610 Frankfort Ave
- 3116 Wheeling Ave
- 2406 Lebanon Ave
- 2510 Federal Ave
- 2300 Red Sky Ln
- 3204 Memphis Ave
- 2413 Copper Ave
- 2917 Mobile Ave
- 2816 N Piedras St
- 3408 Lebanon Ave
- PN-391630 Alabama St
- 3018 Sacramento Ave
- 2827 Louisville Ave
- 2825 Louisville Ave
- 2831 Louisville Ave
- 2823 Louisville Ave
- 2821 Louisville Ave
- 2819 Louisville Ave
- 2820 Richmond Ave
- 2826 Louisville Ave
- 2828 Louisville Ave
- 2824 Louisville Ave
- 2811 Louisville Ave
- 2818 Louisville Ave
- 2814 Richmond Ave
- 2814 Louisville Ave
- 2805 Louisville Ave
- 2812 Louisville Ave
- 2906 Richmond Ave
- 2906 Richmond Ave Unit 1
- 2909 Louisville Ave
- 2808 Richmond Ave