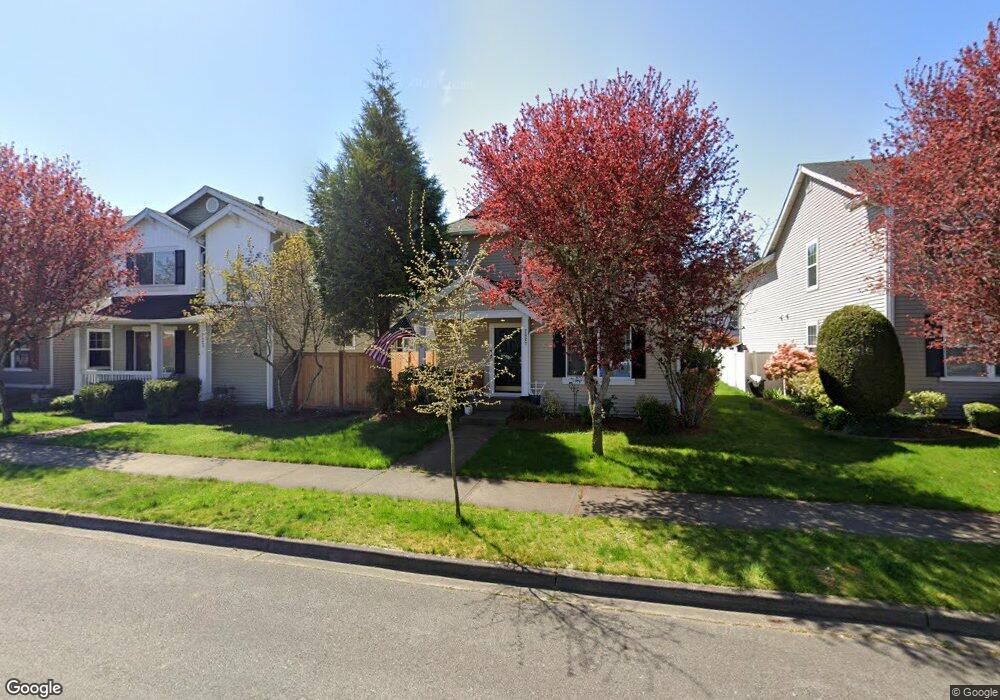
2827 Martin St Dupont, WA 98327
Estimated Value: $498,000 - $520,000
4
Beds
3
Baths
1,504
Sq Ft
$338/Sq Ft
Est. Value
About This Home
This home is located at 2827 Martin St, Dupont, WA 98327 and is currently estimated at $509,021, approximately $338 per square foot. 2827 Martin St is a home located in Pierce County with nearby schools including Chloe Clark Elementary School, Saltars Point Elementary School, and Pioneer Middle School.
Ownership History
Date
Name
Owned For
Owner Type
Purchase Details
Closed on
Dec 14, 2015
Sold by
Pearson Nicole R and Pearson Noah S
Bought by
Hongo Taihei Ellison
Current Estimated Value
Home Financials for this Owner
Home Financials are based on the most recent Mortgage that was taken out on this home.
Original Mortgage
$263,168
Outstanding Balance
$207,843
Interest Rate
3.83%
Mortgage Type
VA
Estimated Equity
$301,178
Purchase Details
Closed on
Dec 28, 2009
Sold by
Weis Kerrie C
Bought by
Pearson Nicole R and Pearson Noah S
Home Financials for this Owner
Home Financials are based on the most recent Mortgage that was taken out on this home.
Original Mortgage
$202,246
Interest Rate
4.78%
Mortgage Type
VA
Purchase Details
Closed on
Jul 2, 2003
Sold by
The Quadrant Corp
Bought by
Weis Kerrie C
Home Financials for this Owner
Home Financials are based on the most recent Mortgage that was taken out on this home.
Original Mortgage
$171,399
Interest Rate
4.5%
Mortgage Type
Purchase Money Mortgage
Create a Home Valuation Report for This Property
The Home Valuation Report is an in-depth analysis detailing your home's value as well as a comparison with similar homes in the area
Home Values in the Area
Average Home Value in this Area
Purchase History
| Date | Buyer | Sale Price | Title Company |
|---|---|---|---|
| Hongo Taihei Ellison | $256,719 | Ticor Title | |
| Pearson Nicole R | $235,000 | Chicago Title Insurance Co | |
| Weis Kerrie C | $180,420 | Chicago Title |
Source: Public Records
Mortgage History
| Date | Status | Borrower | Loan Amount |
|---|---|---|---|
| Open | Hongo Taihei Ellison | $263,168 | |
| Previous Owner | Pearson Nicole R | $202,246 | |
| Previous Owner | Weis Kerrie C | $171,399 |
Source: Public Records
Tax History Compared to Growth
Tax History
| Year | Tax Paid | Tax Assessment Tax Assessment Total Assessment is a certain percentage of the fair market value that is determined by local assessors to be the total taxable value of land and additions on the property. | Land | Improvement |
|---|---|---|---|---|
| 2025 | $3,229 | $447,600 | $211,200 | $236,400 |
| 2024 | $3,229 | $427,200 | $203,500 | $223,700 |
| 2023 | $3,229 | $401,000 | $190,300 | $210,700 |
| 2022 | $3,188 | $407,400 | $190,300 | $217,100 |
| 2021 | $3,024 | $300,100 | $120,900 | $179,200 |
| 2019 | $2,675 | $271,300 | $100,800 | $170,500 |
| 2018 | $2,846 | $261,400 | $100,800 | $160,600 |
| 2017 | $2,549 | $243,700 | $85,500 | $158,200 |
| 2016 | $2,430 | $218,000 | $72,100 | $145,900 |
| 2014 | $2,356 | $215,800 | $72,100 | $143,700 |
| 2013 | $2,356 | $199,800 | $73,900 | $125,900 |
Source: Public Records
Map
Nearby Homes
- 2420 Simmons St Unit B
- 3114 Walker Rd
- 3073 Hoffman Hill Blvd
- 2055 Garry Oaks Ave Unit B
- 1975 Garry Oaks Ave Unit C
- 3178 Hoffman Hill Blvd
- 1375 Foreman Rd
- 3172 Sheaser Way
- 1335 Foreman Rd
- 1305 Foreman Rd
- 1162 Swan Loop
- 1856 Spencer Ct Unit 12F
- 2176 McDonald Ave
- 3572 Hoffman Hill Blvd
- 1607 Kincaid St Unit E-8
- 2237 Tolmie St
- 1680 Kennedy Place Unit A4
- 1061 Hiton Cir
- 2176 Palisade Blvd Unit F-3
- 2147 Hammond Ave Unit B10
- 2831 Martin St
- 2817 Martin St
- 2835 Martin St
- 2818 Hannen St
- 2839 Martin St
- 2811 Martin St
- 2822 Hannen St
- 2814 Hannen St
- 2828 Hannen St
- 2810 Hannen St
- 2824 Martin St
- 2843 Martin St
- 2818 Martin St
- 2834 Hannen St
- 2806 Hannen St
- 2830 Martin St
- 2812 Martin St
- 2840 Hannen St
- 2836 Martin St
- 1975 Jensen Ave