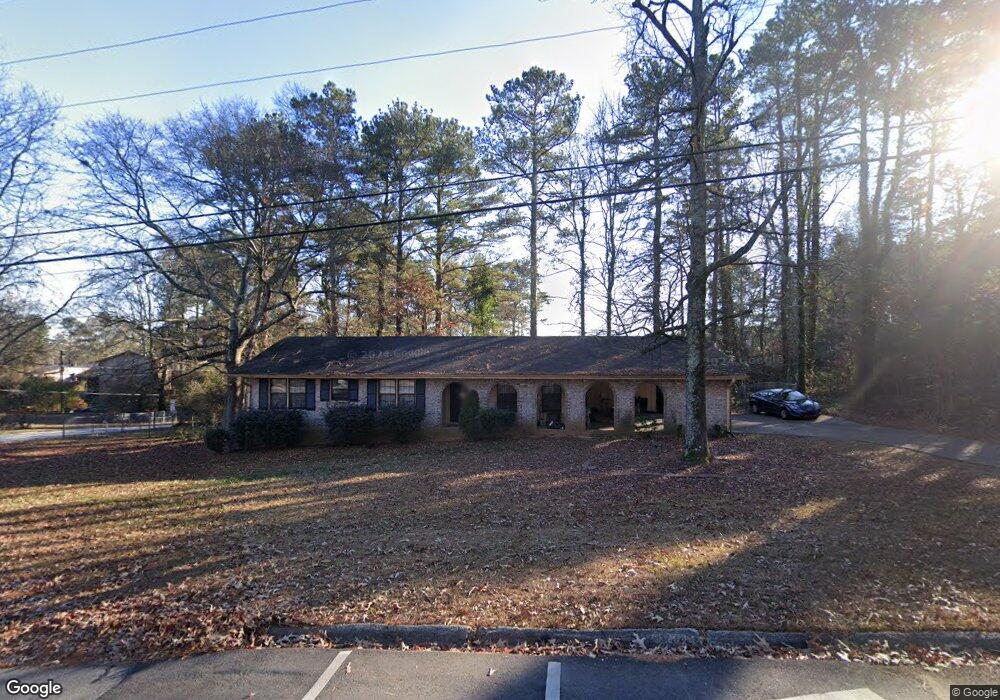
2827 Springlake Dr Buford, GA 30519
Estimated Value: $336,007 - $378,000
3
Beds
2
Baths
1,430
Sq Ft
$247/Sq Ft
Est. Value
About This Home
This home is located at 2827 Springlake Dr, Buford, GA 30519 and is currently estimated at $353,752, approximately $247 per square foot. 2827 Springlake Dr is a home located in Gwinnett County with nearby schools including Buford Elementary School, Buford Senior Academy, and Buford Academy.
Ownership History
Date
Name
Owned For
Owner Type
Purchase Details
Closed on
Dec 20, 2024
Sold by
Fleitz John W
Bought by
Fleitz Amy C and Fleitz John William
Current Estimated Value
Home Financials for this Owner
Home Financials are based on the most recent Mortgage that was taken out on this home.
Original Mortgage
$163,000
Outstanding Balance
$161,585
Interest Rate
6.84%
Mortgage Type
New Conventional
Estimated Equity
$192,167
Purchase Details
Closed on
Jul 10, 2014
Sold by
Fleitz John W
Bought by
Fleitz John W and Fleitz Amy C
Home Financials for this Owner
Home Financials are based on the most recent Mortgage that was taken out on this home.
Original Mortgage
$80,500
Interest Rate
4.26%
Mortgage Type
New Conventional
Purchase Details
Closed on
Oct 7, 2013
Sold by
Fleitz Amy
Bought by
Fleitz John W
Purchase Details
Closed on
Jan 17, 1997
Sold by
Williams Diane
Bought by
Delaney Hugh Catherine
Create a Home Valuation Report for This Property
The Home Valuation Report is an in-depth analysis detailing your home's value as well as a comparison with similar homes in the area
Home Values in the Area
Average Home Value in this Area
Purchase History
| Date | Buyer | Sale Price | Title Company |
|---|---|---|---|
| Fleitz Amy C | -- | -- | |
| Fleitz John W | -- | -- | |
| Fleitz John W | -- | -- | |
| Fleitz John | $35,000 | -- | |
| Delaney Hugh Catherine | $78,500 | -- |
Source: Public Records
Mortgage History
| Date | Status | Borrower | Loan Amount |
|---|---|---|---|
| Open | Fleitz Amy C | $163,000 | |
| Previous Owner | Fleitz John W | $80,500 | |
| Closed | Delaney Hugh Catherine | $0 |
Source: Public Records
Tax History
| Year | Tax Paid | Tax Assessment Tax Assessment Total Assessment is a certain percentage of the fair market value that is determined by local assessors to be the total taxable value of land and additions on the property. | Land | Improvement |
|---|---|---|---|---|
| 2025 | $1,796 | $124,000 | $26,000 | $98,000 |
| 2024 | $1,791 | $124,000 | $26,000 | $98,000 |
| 2023 | $1,791 | $127,920 | $26,000 | $101,920 |
| 2022 | $1,143 | $78,840 | $14,000 | $64,840 |
| 2021 | $1,143 | $78,840 | $14,000 | $64,840 |
| 2020 | $844 | $78,840 | $14,000 | $64,840 |
| 2019 | $764 | $58,000 | $10,000 | $48,000 |
| 2018 | $764 | $58,000 | $10,000 | $48,000 |
| 2016 | $529 | $40,360 | $6,000 | $34,360 |
| 2015 | $548 | $40,360 | $6,000 | $34,360 |
| 2014 | -- | $29,960 | $6,000 | $23,960 |
Source: Public Records
Map
Nearby Homes
- 2802 Lakeview Ct
- 2838 N Bogan Rd
- 2678 N Bogan Rd
- 2997 Spring Lake Dr
- 2997 Springlake Dr
- 3970 Piper Glen Dr
- 2416 Loughridge Dr
- 4184 Thompson Mill Rd
- 2710 Blake Towers Ln
- 3964 Hamilton Mill Rd
- 4375 Easter Lily Ave
- 3016 Sea Aster Way
- 4238 Hamilton Mill Rd
- 4017 S South Bogan Rd
- 2446 Thrasher Rd
- 2352 E Maddox Rd
- 2101 E Maddox Rd
- 2350 E Maddox Rd
- 4023 Lost Oak Dr
- 3483 Lost Oak Dr
- 4180 Springlake Cir
- 2817 Springlake Dr
- 2839 Springlake Dr
- 2826 Springlake Dr
- 2801 N Bogan Rd
- 2807 Springlake Dr
- 2792 Lakeview Ct
- 4175 Springlake Cir Unit 2
- 2811 N Bogan Rd
- 2847 Springlake Dr Unit 1
- 2039 Lakeview Ct
- 2049 Lakeview Ct
- 1968 Lakeview Ct
- 2836 Springlake Dr
- 4176 Springlake Cir
- 2771 N Bogan Rd
- 2782 Lakeview Ct
- 2853 Springlake Dr Unit 1
- 2846 Springlake Dr
- 4161 Springlake Cir
Your Personal Tour Guide
Ask me questions while you tour the home.