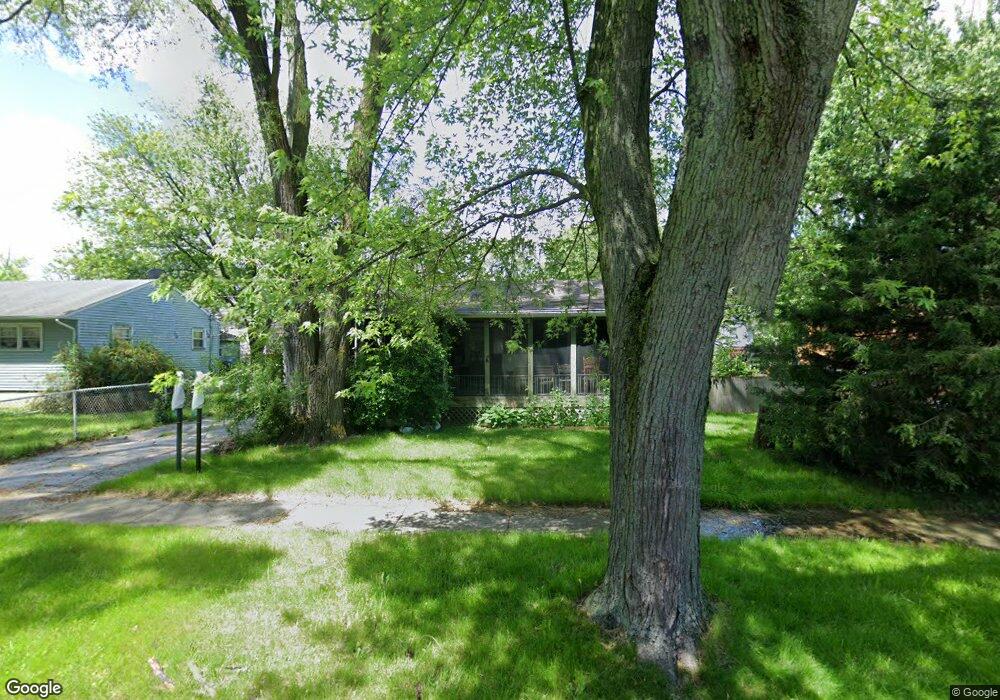
2828 Lorraine Ave Unit 4 Waukegan, IL 60087
Lake County Gardens NeighborhoodEstimated Value: $201,000 - $230,610
3
Beds
1
Bath
1,020
Sq Ft
$208/Sq Ft
Est. Value
About This Home
This home is located at 2828 Lorraine Ave Unit 4, Waukegan, IL 60087 and is currently estimated at $211,903, approximately $207 per square foot. 2828 Lorraine Ave Unit 4 is a home located in Lake County with nearby schools including Little Fort Elementary School, Jack Benny Middle School, and Waukegan High School.
Ownership History
Date
Name
Owned For
Owner Type
Purchase Details
Closed on
Mar 3, 2008
Sold by
Hollen William L
Bought by
Hollen William L and Hollen Carol L
Current Estimated Value
Home Financials for this Owner
Home Financials are based on the most recent Mortgage that was taken out on this home.
Original Mortgage
$93,380
Outstanding Balance
$59,961
Interest Rate
6.32%
Mortgage Type
New Conventional
Estimated Equity
$151,942
Purchase Details
Closed on
Mar 24, 1995
Sold by
Mallek Daniel W and Mallek Patricia
Bought by
Hollen William L
Home Financials for this Owner
Home Financials are based on the most recent Mortgage that was taken out on this home.
Original Mortgage
$86,094
Interest Rate
8.82%
Mortgage Type
FHA
Purchase Details
Closed on
Sep 15, 1979
Sold by
Muss Joshua A
Bought by
Mallek Daniel W and Mallek Patricia
Create a Home Valuation Report for This Property
The Home Valuation Report is an in-depth analysis detailing your home's value as well as a comparison with similar homes in the area
Home Values in the Area
Average Home Value in this Area
Purchase History
| Date | Buyer | Sale Price | Title Company |
|---|---|---|---|
| Hollen William L | -- | None Available | |
| Hollen William L | $87,000 | -- | |
| Mallek Daniel W | $10,500 | -- |
Source: Public Records
Mortgage History
| Date | Status | Borrower | Loan Amount |
|---|---|---|---|
| Open | Hollen William L | $93,380 | |
| Closed | Hollen William L | $86,094 |
Source: Public Records
Tax History Compared to Growth
Tax History
| Year | Tax Paid | Tax Assessment Tax Assessment Total Assessment is a certain percentage of the fair market value that is determined by local assessors to be the total taxable value of land and additions on the property. | Land | Improvement |
|---|---|---|---|---|
| 2024 | $4,947 | $66,933 | $8,420 | $58,513 |
| 2023 | $4,947 | $60,467 | $7,606 | $52,861 |
| 2022 | $3,936 | $46,263 | $7,247 | $39,016 |
| 2021 | $3,591 | $40,440 | $6,274 | $34,166 |
| 2020 | $3,591 | $37,675 | $5,845 | $31,830 |
| 2019 | $3,561 | $34,523 | $5,356 | $29,167 |
| 2018 | $2,847 | $28,405 | $6,824 | $21,581 |
| 2017 | $2,721 | $25,130 | $6,037 | $19,093 |
| 2016 | $2,447 | $21,837 | $5,246 | $16,591 |
| 2015 | $2,288 | $19,544 | $4,695 | $14,849 |
| 2014 | $2,827 | $22,247 | $5,458 | $16,789 |
| 2012 | $3,724 | $24,103 | $5,913 | $18,190 |
Source: Public Records
Map
Nearby Homes
- 1612 Whitney St
- 1636 Rice St
- 2613 N Lewis Ave
- 3211 Rugby Ct
- 2350 N Lewis Ave
- 37966 N Cornell Rd
- 3411 N Lewis Ave
- 37905 N Loyola Ave
- 3101 Country Club Ln
- 2232 Walnut St
- 2708 Dana Ave
- 2705 Dana Ave
- 38127 N Shore Ave
- 38362 N Manor Ave
- 12312 W Audrey Ave
- 2713 Varonen Ave
- 301 W Eagle Ct
- 0 Traditions Dr
- 10241 W Bairstow Ave
- 1730 W Beach Rd
- 2824 Lorraine Ave
- 2832 Lorraine Ave
- 2829 N Elmwood Ave Unit 4
- 2833 N Elmwood Ave
- 2825 N Elmwood Ave
- 2820 Lorraine Ave
- 2836 Lorraine Ave
- 2821 N Elmwood Ave
- 2831 Lorraine Ave
- 1667 Frazier St
- 1705 Mc Kay St
- 2816 Lorraine Ave
- 1705 Mckay St
- 2819 Lorraine Ave
- 2817 N Elmwood Ave
- 1670 Frazier St Unit 4
- 1709 Mckay St
- 2835 Lorraine Ave
- 2812 Lorraine Ave