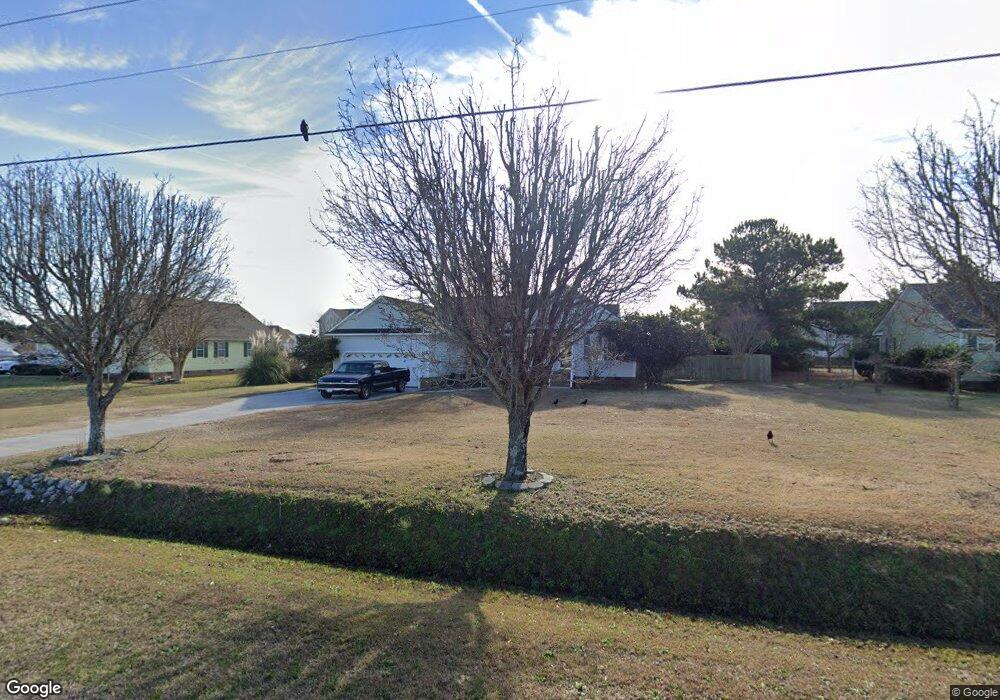
2828 Sloop Point Loop Rd Hampstead, NC 28443
Estimated Value: $374,000 - $536,000
3
Beds
2
Baths
1,645
Sq Ft
$266/Sq Ft
Est. Value
About This Home
This home is located at 2828 Sloop Point Loop Rd, Hampstead, NC 28443 and is currently estimated at $437,301, approximately $265 per square foot. 2828 Sloop Point Loop Rd is a home located in Pender County with nearby schools including North Topsail Elementary School, Topsail Middle School, and Topsail High School.
Ownership History
Date
Name
Owned For
Owner Type
Purchase Details
Closed on
Oct 25, 2024
Sold by
Kevin J Smith Properties Llc
Bought by
Pride Troy
Current Estimated Value
Home Financials for this Owner
Home Financials are based on the most recent Mortgage that was taken out on this home.
Original Mortgage
$195,000
Outstanding Balance
$118,121
Interest Rate
6.2%
Mortgage Type
Seller Take Back
Estimated Equity
$319,180
Purchase Details
Closed on
Jan 23, 2018
Sold by
Smith Kevin and Smith Amy
Bought by
Kevin J Smith Properties Llc
Purchase Details
Closed on
Mar 26, 2009
Sold by
Trout Howard Carl
Bought by
Tyler Jason Michael and Tyler Megan Ashley
Home Financials for this Owner
Home Financials are based on the most recent Mortgage that was taken out on this home.
Original Mortgage
$188,977
Interest Rate
5.13%
Mortgage Type
VA
Create a Home Valuation Report for This Property
The Home Valuation Report is an in-depth analysis detailing your home's value as well as a comparison with similar homes in the area
Home Values in the Area
Average Home Value in this Area
Purchase History
| Date | Buyer | Sale Price | Title Company |
|---|---|---|---|
| Pride Troy | $345,000 | Cape Fear Title | |
| Kevin J Smith Properties Llc | -- | None Available | |
| Tyler Jason Michael | $185,000 | -- |
Source: Public Records
Mortgage History
| Date | Status | Borrower | Loan Amount |
|---|---|---|---|
| Open | Pride Troy | $195,000 | |
| Previous Owner | Tyler Jason Michael | $188,977 |
Source: Public Records
Tax History
| Year | Tax Paid | Tax Assessment Tax Assessment Total Assessment is a certain percentage of the fair market value that is determined by local assessors to be the total taxable value of land and additions on the property. | Land | Improvement |
|---|---|---|---|---|
| 2025 | $2,590 | $459,025 | $198,800 | $260,225 |
| 2024 | $2,590 | $258,328 | $81,632 | $176,696 |
| 2023 | $2,261 | $258,328 | $81,632 | $176,696 |
| 2022 | $2,261 | $258,328 | $81,632 | $176,696 |
| 2021 | $2,261 | $258,328 | $81,632 | $176,696 |
| 2020 | $2,261 | $258,328 | $81,632 | $176,696 |
| 2019 | $2,261 | $258,328 | $81,632 | $176,696 |
| 2018 | $1,843 | $198,681 | $62,100 | $136,581 |
| 2017 | $1,843 | $198,681 | $62,100 | $136,581 |
| 2016 | $1,824 | $198,681 | $62,100 | $136,581 |
| 2015 | -- | $198,681 | $62,100 | $136,581 |
| 2014 | $1,503 | $198,681 | $62,100 | $136,581 |
| 2013 | -- | $198,681 | $62,100 | $136,581 |
| 2012 | -- | $198,681 | $62,100 | $136,581 |
Source: Public Records
Map
Nearby Homes
- 2689 Sloop Point Loop Rd
- Tract B Twin Oaks Dr
- Tract A Twin Oaks Dr
- 278 Lewis Rd
- Lot 46 Salt Marsh Ln
- 32 Salt Marsh Ln
- 6 Oak View Ln
- 203 Moores Landing Ct
- 101 Cottage Walk
- 120 Moores Landing Rd
- 154 Cotherstone Ct
- 113 Moores Landing Rd
- 151 Shelley Rd
- 104 Grey Moss Ct
- 85 Lookout Point
- 181 Lookout Point
- 155 Lookout Point
- 114 Old Farm Rd
- 72 Lookout Point
- 158 Lookout Point
- 2808 Sloop Point Loop Rd
- 22 Kenneth Lee Dr
- 44 W Brenda Lee Dr
- 68 W Brenda Lee Dr
- 22 W Brenda Lee Dr
- 2790 Sloop Point Loop Rd
- 94 W Brenda Lee Dr
- 2892 Kenneth Lee Dr
- 2892 Sloop Point Loop Rd
- 2764 Sloop Point Loop Rd
- 59 W Brenda Lee Dr
- 2902 Sloop Point Loop Rd
- 23 W Brenda Lee Dr
- 104 W Brenda Lee Dr
- 104 W Brenda Lee Rd
- 83 W Brenda Lee Dr
- 39 E Brenda Lee Dr
- 39 E Brenda Lee Rd
- 2742 Sloop Point Loop Rd
- 2885 Sloop Point Loop Rd
Your Personal Tour Guide
Ask me questions while you tour the home.