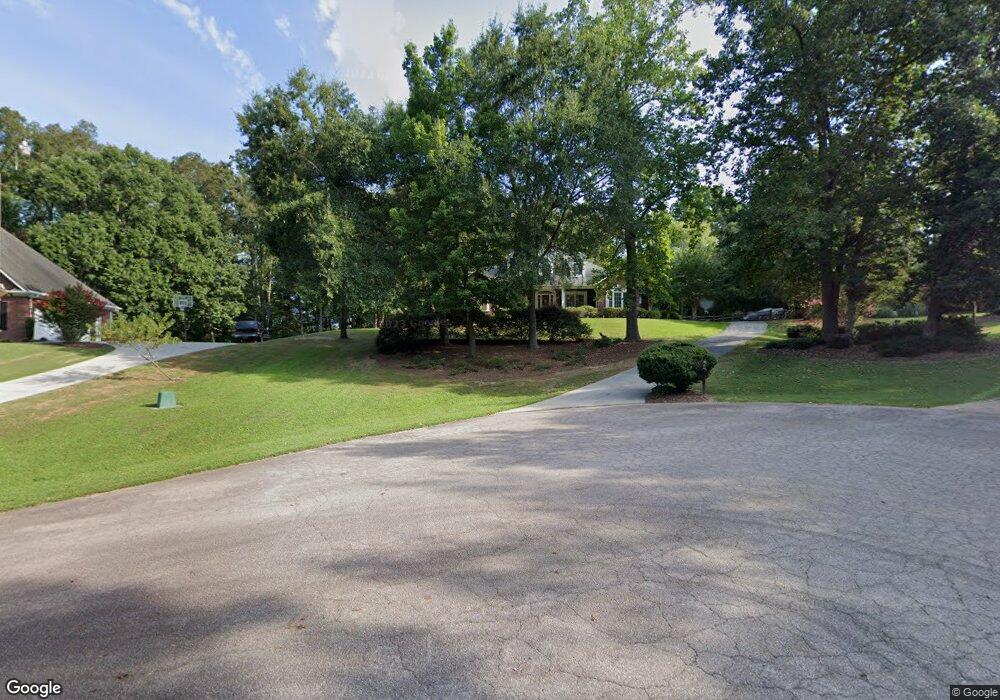
2829 Allendale Ct Concord, NC 28025
Estimated Value: $611,000 - $677,000
4
Beds
3
Baths
2,986
Sq Ft
$216/Sq Ft
Est. Value
About This Home
This home is located at 2829 Allendale Ct, Concord, NC 28025 and is currently estimated at $644,619, approximately $215 per square foot. 2829 Allendale Ct is a home located in Cabarrus County with nearby schools including A.T. Allen Elementary School, Mount Pleasant Middle School, and Mount Pleasant High School.
Ownership History
Date
Name
Owned For
Owner Type
Purchase Details
Closed on
Mar 30, 2007
Sold by
Peters David A and Peters Robyn M
Bought by
Wallace Terri L and Accardo James M
Current Estimated Value
Home Financials for this Owner
Home Financials are based on the most recent Mortgage that was taken out on this home.
Original Mortgage
$273,750
Outstanding Balance
$166,606
Interest Rate
6.27%
Mortgage Type
Purchase Money Mortgage
Estimated Equity
$478,013
Purchase Details
Closed on
Jul 27, 2001
Sold by
Fowler Bobby L and Fowler Elizabeth S
Bought by
Peters David A and Peters Robyn M
Home Financials for this Owner
Home Financials are based on the most recent Mortgage that was taken out on this home.
Original Mortgage
$200,000
Interest Rate
6.37%
Purchase Details
Closed on
Oct 1, 1996
Bought by
Fowler Bobby L and Fowler Wf
Create a Home Valuation Report for This Property
The Home Valuation Report is an in-depth analysis detailing your home's value as well as a comparison with similar homes in the area
Home Values in the Area
Average Home Value in this Area
Purchase History
| Date | Buyer | Sale Price | Title Company |
|---|---|---|---|
| Wallace Terri L | $365,000 | None Available | |
| Peters David A | $283,000 | -- | |
| Fowler Bobby L | $30,000 | -- |
Source: Public Records
Mortgage History
| Date | Status | Borrower | Loan Amount |
|---|---|---|---|
| Open | Wallace Terri L | $273,750 | |
| Closed | Wallace Terri L | $91,250 | |
| Previous Owner | Peters David A | $200,000 | |
| Closed | Peters David A | $50,000 |
Source: Public Records
Tax History Compared to Growth
Tax History
| Year | Tax Paid | Tax Assessment Tax Assessment Total Assessment is a certain percentage of the fair market value that is determined by local assessors to be the total taxable value of land and additions on the property. | Land | Improvement |
|---|---|---|---|---|
| 2025 | $4,100 | $597,680 | $102,000 | $495,680 |
| 2024 | $4,100 | $597,680 | $102,000 | $495,680 |
| 2023 | $3,430 | $403,550 | $75,000 | $328,550 |
| 2022 | $3,349 | $403,550 | $75,000 | $328,550 |
| 2021 | $3,289 | $403,550 | $75,000 | $328,550 |
| 2020 | $3,289 | $403,550 | $75,000 | $328,550 |
| 2019 | $2,918 | $358,090 | $53,000 | $305,090 |
| 2018 | $2,847 | $358,090 | $53,000 | $305,090 |
| 2017 | $2,704 | $358,090 | $53,000 | $305,090 |
| 2016 | $2,704 | $307,320 | $45,000 | $262,320 |
| 2015 | $2,290 | $307,320 | $45,000 | $262,320 |
| 2014 | $2,290 | $307,320 | $45,000 | $262,320 |
Source: Public Records
Map
Nearby Homes
- 2817 Allendale Ct
- 2911 Buffalo Hills Dr
- 2369 Baxter Place SE
- 2365 Baxter Place SE
- 2314 Fairport Dr SE
- 1695 Lemming Dr
- 2625 Old Airport Rd
- 1121 Setter Ln SE
- 1665 Red Bird Cir
- 153 Cottontail Ln SE Unit 46
- 1106 Setter Ln SE
- 1146 Crestmont Dr SE
- 1076 Tangle Ridge Dr SE
- 3350 Miami Church Rd
- 1508 Thompson Dr
- 2406 Everton Cir SE
- 51 Plott Dr SW
- 1128 Tangle Ridge Dr SE
- 1300 Hess Rd
- 6175 U S 601
- lot 1B Huntley Ridge
- 2825 Allendale Ct
- 2833 Allendale Ct
- 2821 Allendale Ct
- 2 Oak Building Chetola Estes Dr
- 135 Sarahs Spring
- 2861 Heglar Rd
- 2837 Heglar Rd
- 2840 Allendale Ct
- 2814 Allendale Ct
- 2809 Allendale Ct
- 2845 Heglar Rd
- 2849 Heglar Rd
- 2895 Heglar Rd
- 2919 Heglar Rd
- 2805 Allendale Ct
- 2802 Allendale Ct
- 2888 Highway 49 N
- 2801 Allendale Ct
- 2850 Heglar Rd