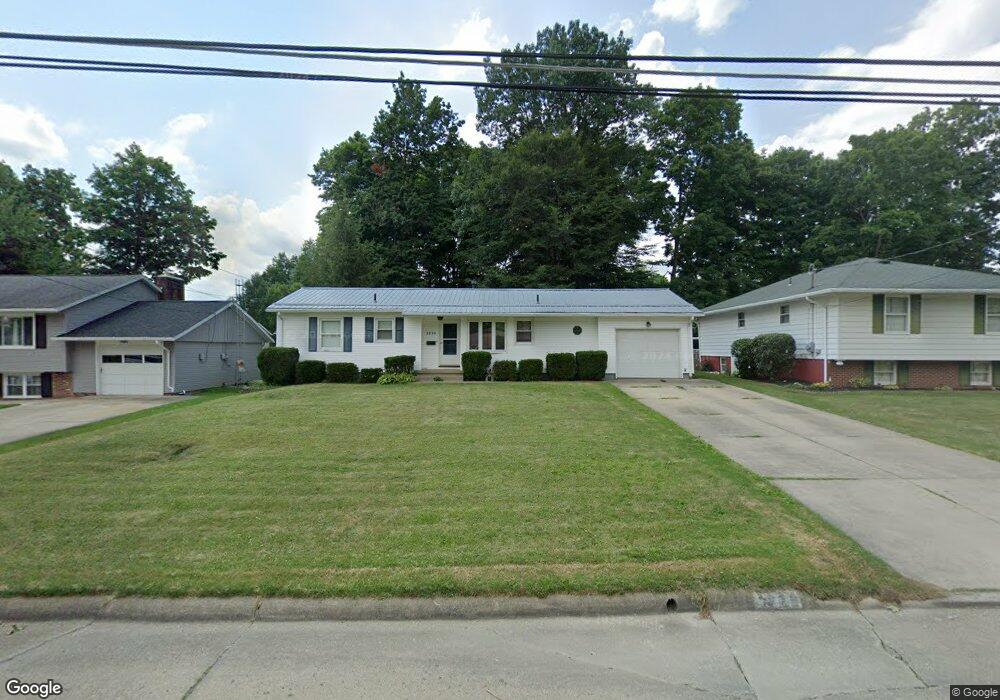
2829 Center Ave Alliance, OH 44601
Estimated Value: $179,265 - $204,000
3
Beds
2
Baths
1,002
Sq Ft
$190/Sq Ft
Est. Value
About This Home
This home is located at 2829 Center Ave, Alliance, OH 44601 and is currently estimated at $190,566, approximately $190 per square foot. 2829 Center Ave is a home located in Stark County with nearby schools including Alliance Elementary School at Rockhill, Alliance Intermediate School at Northside, and Alliance Middle School.
Ownership History
Date
Name
Owned For
Owner Type
Purchase Details
Closed on
Jan 19, 2019
Sold by
Hatherill Jodi A and Brien Shane P O
Bought by
Hatherill Jodi A and Brien Shane P O
Current Estimated Value
Purchase Details
Closed on
Nov 7, 2007
Sold by
Hatherill James L and Hatherill Debra J
Bought by
Hatherill Jodi A
Purchase Details
Closed on
Jul 27, 2005
Sold by
Hatherill Robert J and Hatherill Sheri L
Bought by
Hatherill James L and Hatherill Debra J
Home Financials for this Owner
Home Financials are based on the most recent Mortgage that was taken out on this home.
Original Mortgage
$85,600
Interest Rate
5.74%
Mortgage Type
Fannie Mae Freddie Mac
Purchase Details
Closed on
Feb 24, 2005
Sold by
Hatherill Robert J and Hatherill Sheri L
Bought by
Hatherill Robert J and Hatherill Sheri L
Create a Home Valuation Report for This Property
The Home Valuation Report is an in-depth analysis detailing your home's value as well as a comparison with similar homes in the area
Home Values in the Area
Average Home Value in this Area
Purchase History
| Date | Buyer | Sale Price | Title Company |
|---|---|---|---|
| Hatherill Jodi A | -- | None Available | |
| Hatherill Jodi A | -- | Attorney | |
| Hatherill James L | $107,000 | Union Title Co | |
| Hatherill Robert J | -- | -- |
Source: Public Records
Mortgage History
| Date | Status | Borrower | Loan Amount |
|---|---|---|---|
| Previous Owner | Hatherill James L | $85,600 |
Source: Public Records
Tax History
| Year | Tax Paid | Tax Assessment Tax Assessment Total Assessment is a certain percentage of the fair market value that is determined by local assessors to be the total taxable value of land and additions on the property. | Land | Improvement |
|---|---|---|---|---|
| 2025 | -- | $52,570 | $13,230 | $39,340 |
| 2024 | -- | $52,570 | $13,230 | $39,340 |
| 2023 | $1,648 | $41,020 | $11,130 | $29,890 |
| 2022 | $830 | $41,020 | $11,130 | $29,890 |
| 2021 | $1,661 | $41,020 | $11,130 | $29,890 |
| 2020 | $1,536 | $35,430 | $9,700 | $25,730 |
| 2019 | $1,514 | $35,430 | $9,700 | $25,730 |
| 2018 | $1,521 | $35,430 | $9,700 | $25,730 |
| 2017 | $1,373 | $31,470 | $8,260 | $23,210 |
| 2016 | $1,447 | $32,900 | $8,260 | $24,640 |
| 2015 | $1,460 | $32,900 | $8,260 | $24,640 |
| 2014 | $1,497 | $32,100 | $8,050 | $24,050 |
| 2013 | $747 | $32,100 | $8,050 | $24,050 |
Source: Public Records
Map
Nearby Homes
- 2630 Blenheim Ave
- 2635 Blenheim Ave
- 2619 Center Ave
- 3018 Blenheim Ave
- 24865 Center Ave
- 2580 Edgewood Ave
- 2435 Eastern Ave
- 2229 Western Ave
- 0 Winchester St
- 0 Winchester St Unit 5162877
- 856 Birchwood Dr
- 2120 Blenheim Ave
- 2420 Beechwood Ave
- 29 Colony Dr
- 31 Colony Dr
- 0 Federal Ave
- 3116 Ridgehill Ave
- 2625 Belleflower Dr
- 2705 Shunk Ave
- 2626 Shunk Ave
- 2819 Center Ave
- 2839 Center Ave
- 2832 Blenheim Ave
- 2809 Center Ave
- 2849 Center Ave
- 2842 Blenheim Ave
- 2822 Blenheim Ave
- 2830 Center Ave
- 2820 Center Ave
- 2840 Center Ave
- 2852 Blenheim Ave
- 2812 Blenheim Ave
- 2859 Center Ave
- 2801 Center Ave
- 2810 Center Ave
- 2850 Center Ave
- 2862 Blenheim Ave
- 2802 Blenheim Ave
- 2800 Center Ave
- 2860 Center Ave
Your Personal Tour Guide
Ask me questions while you tour the home.