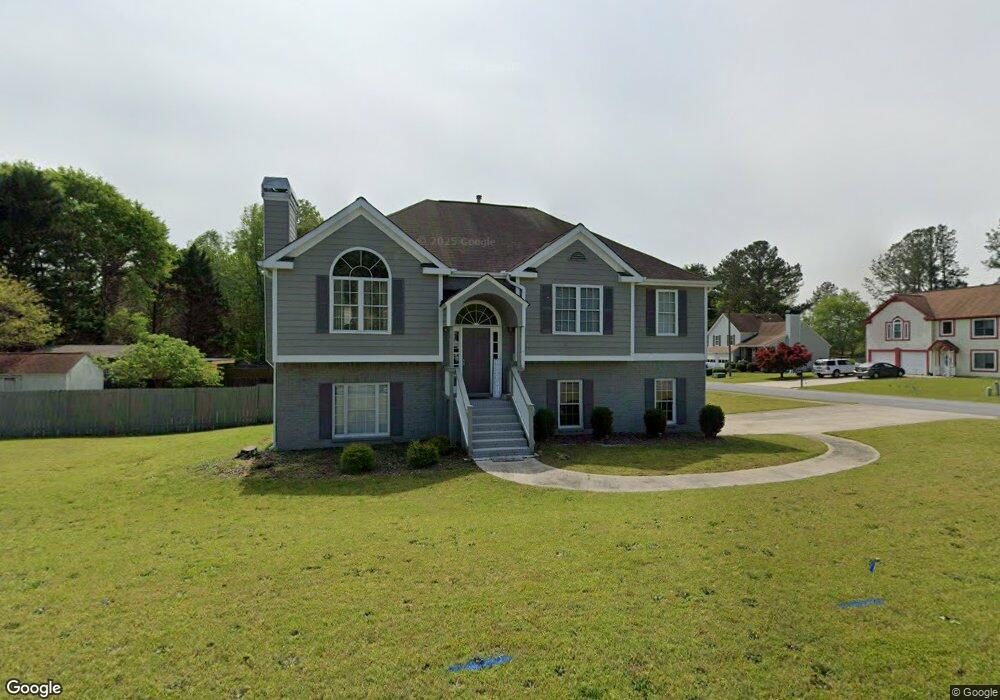
2829 Overlake Run Powder Springs, GA 30127
Estimated Value: $331,476 - $383,000
4
Beds
3
Baths
1,867
Sq Ft
$186/Sq Ft
Est. Value
About This Home
This home is located at 2829 Overlake Run, Powder Springs, GA 30127 and is currently estimated at $347,869, approximately $186 per square foot. 2829 Overlake Run is a home located in Cobb County with nearby schools including Dowell Elementary School, Tapp Middle School, and McEachern High School.
Ownership History
Date
Name
Owned For
Owner Type
Purchase Details
Closed on
Mar 8, 2011
Sold by
Chase Hm Fin Llc
Bought by
Federal Natl Mtg Assn Fnma
Current Estimated Value
Purchase Details
Closed on
Mar 1, 2011
Sold by
Flores Dora A and Flores Jose
Bought by
Chase Hm Fin Llc
Purchase Details
Closed on
Oct 23, 2006
Sold by
Kemp Christine
Bought by
Flores Dora A and Flores Jose
Home Financials for this Owner
Home Financials are based on the most recent Mortgage that was taken out on this home.
Original Mortgage
$25,500
Interest Rate
6.31%
Mortgage Type
New Conventional
Purchase Details
Closed on
May 25, 1993
Sold by
Venture Homes Inc
Bought by
Kemp John G
Home Financials for this Owner
Home Financials are based on the most recent Mortgage that was taken out on this home.
Original Mortgage
$105,850
Interest Rate
7.42%
Mortgage Type
FHA
Create a Home Valuation Report for This Property
The Home Valuation Report is an in-depth analysis detailing your home's value as well as a comparison with similar homes in the area
Home Values in the Area
Average Home Value in this Area
Purchase History
| Date | Buyer | Sale Price | Title Company |
|---|---|---|---|
| Federal Natl Mtg Assn Fnma | -- | -- | |
| Chase Hm Fin Llc | $66,200 | -- | |
| Flores Dora A | $170,000 | -- | |
| Kemp Christine | -- | -- | |
| Kemp John G | $107,000 | -- |
Source: Public Records
Mortgage History
| Date | Status | Borrower | Loan Amount |
|---|---|---|---|
| Previous Owner | Kemp Christine | $25,500 | |
| Previous Owner | Kemp Christine | $136,000 | |
| Previous Owner | Kemp John G | $105,850 |
Source: Public Records
Tax History Compared to Growth
Tax History
| Year | Tax Paid | Tax Assessment Tax Assessment Total Assessment is a certain percentage of the fair market value that is determined by local assessors to be the total taxable value of land and additions on the property. | Land | Improvement |
|---|---|---|---|---|
| 2025 | $2,362 | $78,400 | $17,200 | $61,200 |
| 2024 | $4,699 | $155,840 | $34,000 | $121,840 |
| 2023 | $3,688 | $122,308 | $18,000 | $104,308 |
| 2022 | $2,135 | $70,332 | $7,200 | $63,132 |
| 2021 | $2,135 | $70,332 | $7,200 | $63,132 |
| 2020 | $2,135 | $70,332 | $7,200 | $63,132 |
| 2019 | $1,810 | $59,644 | $4,800 | $54,844 |
| 2018 | $1,810 | $59,644 | $4,800 | $54,844 |
| 2017 | $1,715 | $59,644 | $4,800 | $54,844 |
| 2016 | $1,329 | $46,240 | $4,800 | $41,440 |
| 2015 | $1,362 | $46,240 | $4,800 | $41,440 |
| 2014 | $914 | $30,768 | $0 | $0 |
Source: Public Records
Map
Nearby Homes
- 3272 Barnwell Trace
- 2691 Tucson Way
- 3161 Tucson Ct Unit 8
- 2752 Owens Ave SW Unit 5
- 2657 John Petree Rd
- 2627 Beaver Creek Crossing
- 2723 Horseshoe Creek Dr SW
- 3235 Avondale Pkwy
- 2599 Candler Way SW
- 3088 Yellowhammer Dr
- 3088 Yellowhammer Dr Unit 32
- 2885 Mondavi Place
- 2730 Hembree Rd SW
- 2700 Hembree Rd
- Salisbury Plan at Barrett Cove
- Sudbury Plan at Barrett Cove
- Stratford Plan at Barrett Cove
- 2705 Owens Ave SW
- 3118 Yellowhammer Dr Unit 25
- 3106 Yellowhammer Dr Unit 28
- 2833 Overlake Run
- 2654 Barnwell Ln
- 2651 Barnwell Ln
- 2834 Overlake Run
- 2835 Overlake Run
- 2830 Overlake Run
- 2838 Overlake Run Unit 3
- 2826 Overlake Run
- 2653 Barnwell Ln Unit 3
- 2656 Barnwell Ln Unit 3
- 2839 Overlake Run
- 2817 Overlake Run Unit 3
- 2655 Barnwell Ln Unit 3
- 2842 Overlake Run
- 2820 Overlake Run
- 2841 Overlake Run
- 2816 Overlake Run Unit 3
- 2657 Barnwell Ln
- 3263 Barnwell Trace
- 2813 Overlake Run Unit 3